Question

How can I display amalgamated vulnerability intelligence on a dashboard?

  • February 27, 2026
  • 1 reply
  • 57 views

Forum|alt.badge.img

I have a ton of open and closed sources feeding reports, vulnerabilities & CVE indicators into ThreatQ. Because “reports”, “vulnerabilities”, and “indicators” are all different threat libraries inside of ThreatQ, I’ve struggled to find a way to display the amalgamated vulnerability intelligence in one consolidated view that the vulnerability management team can use to track what matters.

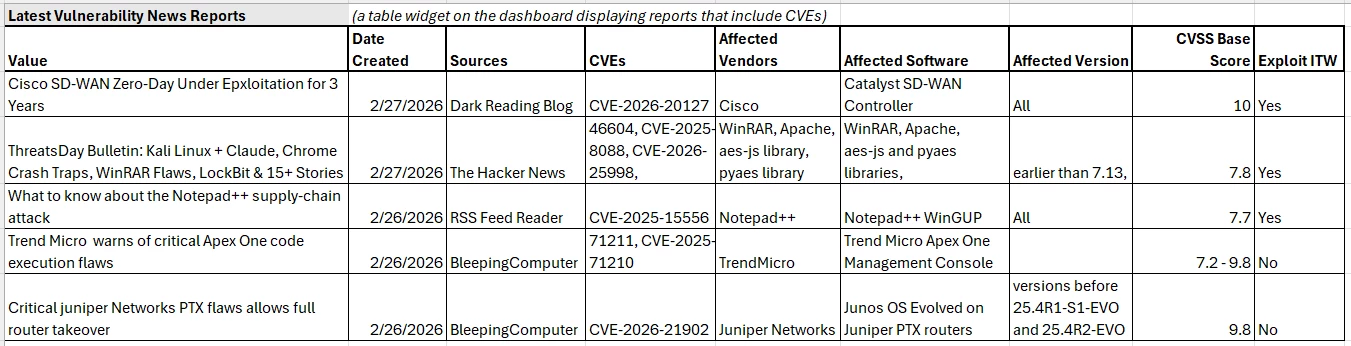
I have mocked up the utopian version of what I want to display. How do I create this for real in ThreatQ? All of the data currently exists in ThreatQ, but it’s spread across the three different threat libraries, and none of it exists in all 3 simultaneously. 

This seems potentially possible using workflows where you would parse out the CVEs from each report, then append the attributes from the indicator and vulnerability threat libraries into the report. But I don’t know if that’s possible or how I would achieve this. 


1 reply

Forum|alt.badge.img+1

Hey ​@Brill , part of the beauty of ThreatQ is its flexibility. However, that comes with a great deal of power as it pertains to defining the actual standards within the platform.

To achieve what you’re looking for, I think we need to take a few step approach:


1. Define the standard for CVEs

CVEs can be ingested into ThreatQ as either Indicators (with a subtype of CVE), or as vulnerability objects.

The benefit of using the Indicator object is that you can leverage ThreatQ’s Scoring Policy to prioritize CVEs based on things like CVSS metadata or Affected Products/Vendors. At the moment, Vulnerability objects cannot be scored. However, if your organization doesn’t have the need to score these CVEs, then that may not factor into your decision.

Once you define which object type you want to use, you’ll want to make sure that all of your integrations are configured to ingest CVEs as that selected object type. Most all integrations will have a user field named, “Ingest CVEs As”, which the option to choose Indicator or Vulnerability (sometimes both).


2. Configure a Workflow to Automatically Extract CVEs

While many integrations have CVE extraction built-in, we want to make sure that CVE extraction is integration-independent, and can happen on Objects no matter what source it came from.

To do this, we’ll use the ThreatQ ACE action, which you can find on our Marketplace here:

https://marketplace.threatq.com/details/threatq-ace-action

Install the action, and then you’ll need to do the following:

  1. Define a data collection selecting the reports (or other objects) you want to parse the CVEs from
  2. Create a new workflow
  3. Add the ThreatQ ACE action to it and configure it to extract “Indicators”, selecting only the “CVE” type from the Parsed IOC Types field.
    • If you’d like, you can configure it to parse additional context out, but for this use-case, we only need CVEs
  4. Configure the action to ingest CVEs as the object type you selected in part 1
  5. Select the middle node of the workflow and configure a schedule for the workflow to run (recommended: every 1 hour)
  6. Save & Enable the workflow
    • The workflow should kick off and start extracting context from your selected reports

At this point, you’ll have Reports + Related CVEs


3. Configure CVE Feeds or CVE Enrichment

Now that you have the CVEs extracted, you’ll want to make sure that they have context associated with them. You can do this 2 ways:

  1. Install a feed like NVD to populate your ThreatQ instance with CVEs and their context
  2. Install an action like the NVD action to enrich the existing CVEs in your system

Once you have the feeds running and/or workflows enriching the CVEs, you’ll end up with Reports + CVEs + CVE Context


4. Reporting

Here is where we put everything together. Now we have all of the context we need to build a dashboard/report similar to your screenshot.

First, create a data collection in your Threat Library, selecting the Reports created within the last 7 days (for example), that have a relationship criteria to the object type you’re using for CVEs. If using Indicators, make sure to select the CVE subtype. This will allow us to select “new” reports that talk about vulnerabilities.

Second, create another data collection in your Threat Library, selecting the CVEs related to reports modified within the past 7 days (for example; basically the opposite direction as the first data collection). 

Next, create a new dashboard to show off this information. At the moment, there is no way to show the related CVEs + context alongside the reports, however, that will likely be an enhancement we will make in future dashboarding updates.

Instead, you can create a dashboard widget table for the recent reports pertaining to those CVEs, with the CVE count in one of the columns. Create another dashboard widget table for the 2nd data collection, keying in on the CVEs. In this table, you’ll be able to include the context such as Affected Vendor, Affected Software, and the CVSS Score..

You can also re-use the CVE data collection for showing pie charts, bar charts, count widgets, etc. that does a deeper dive into the analytics of the recently observed vulnerabilities.

-------------------------------------------------------

If you find that you would like to see enhancements made to dashboarding to give you a better ability to report on this vulnerability data, please do not hesitate to open a feature request through our support team!

If you are on the more technical side, you can leverage our exports system to build out a custom HTML page (using Smarty templates) to view a customized dashboard showing exactly what you need.