

How to Troubleshoot Logs Not Appearing in Securonix
Audience: Securonix Administrators, Security Analysts, MSSPs
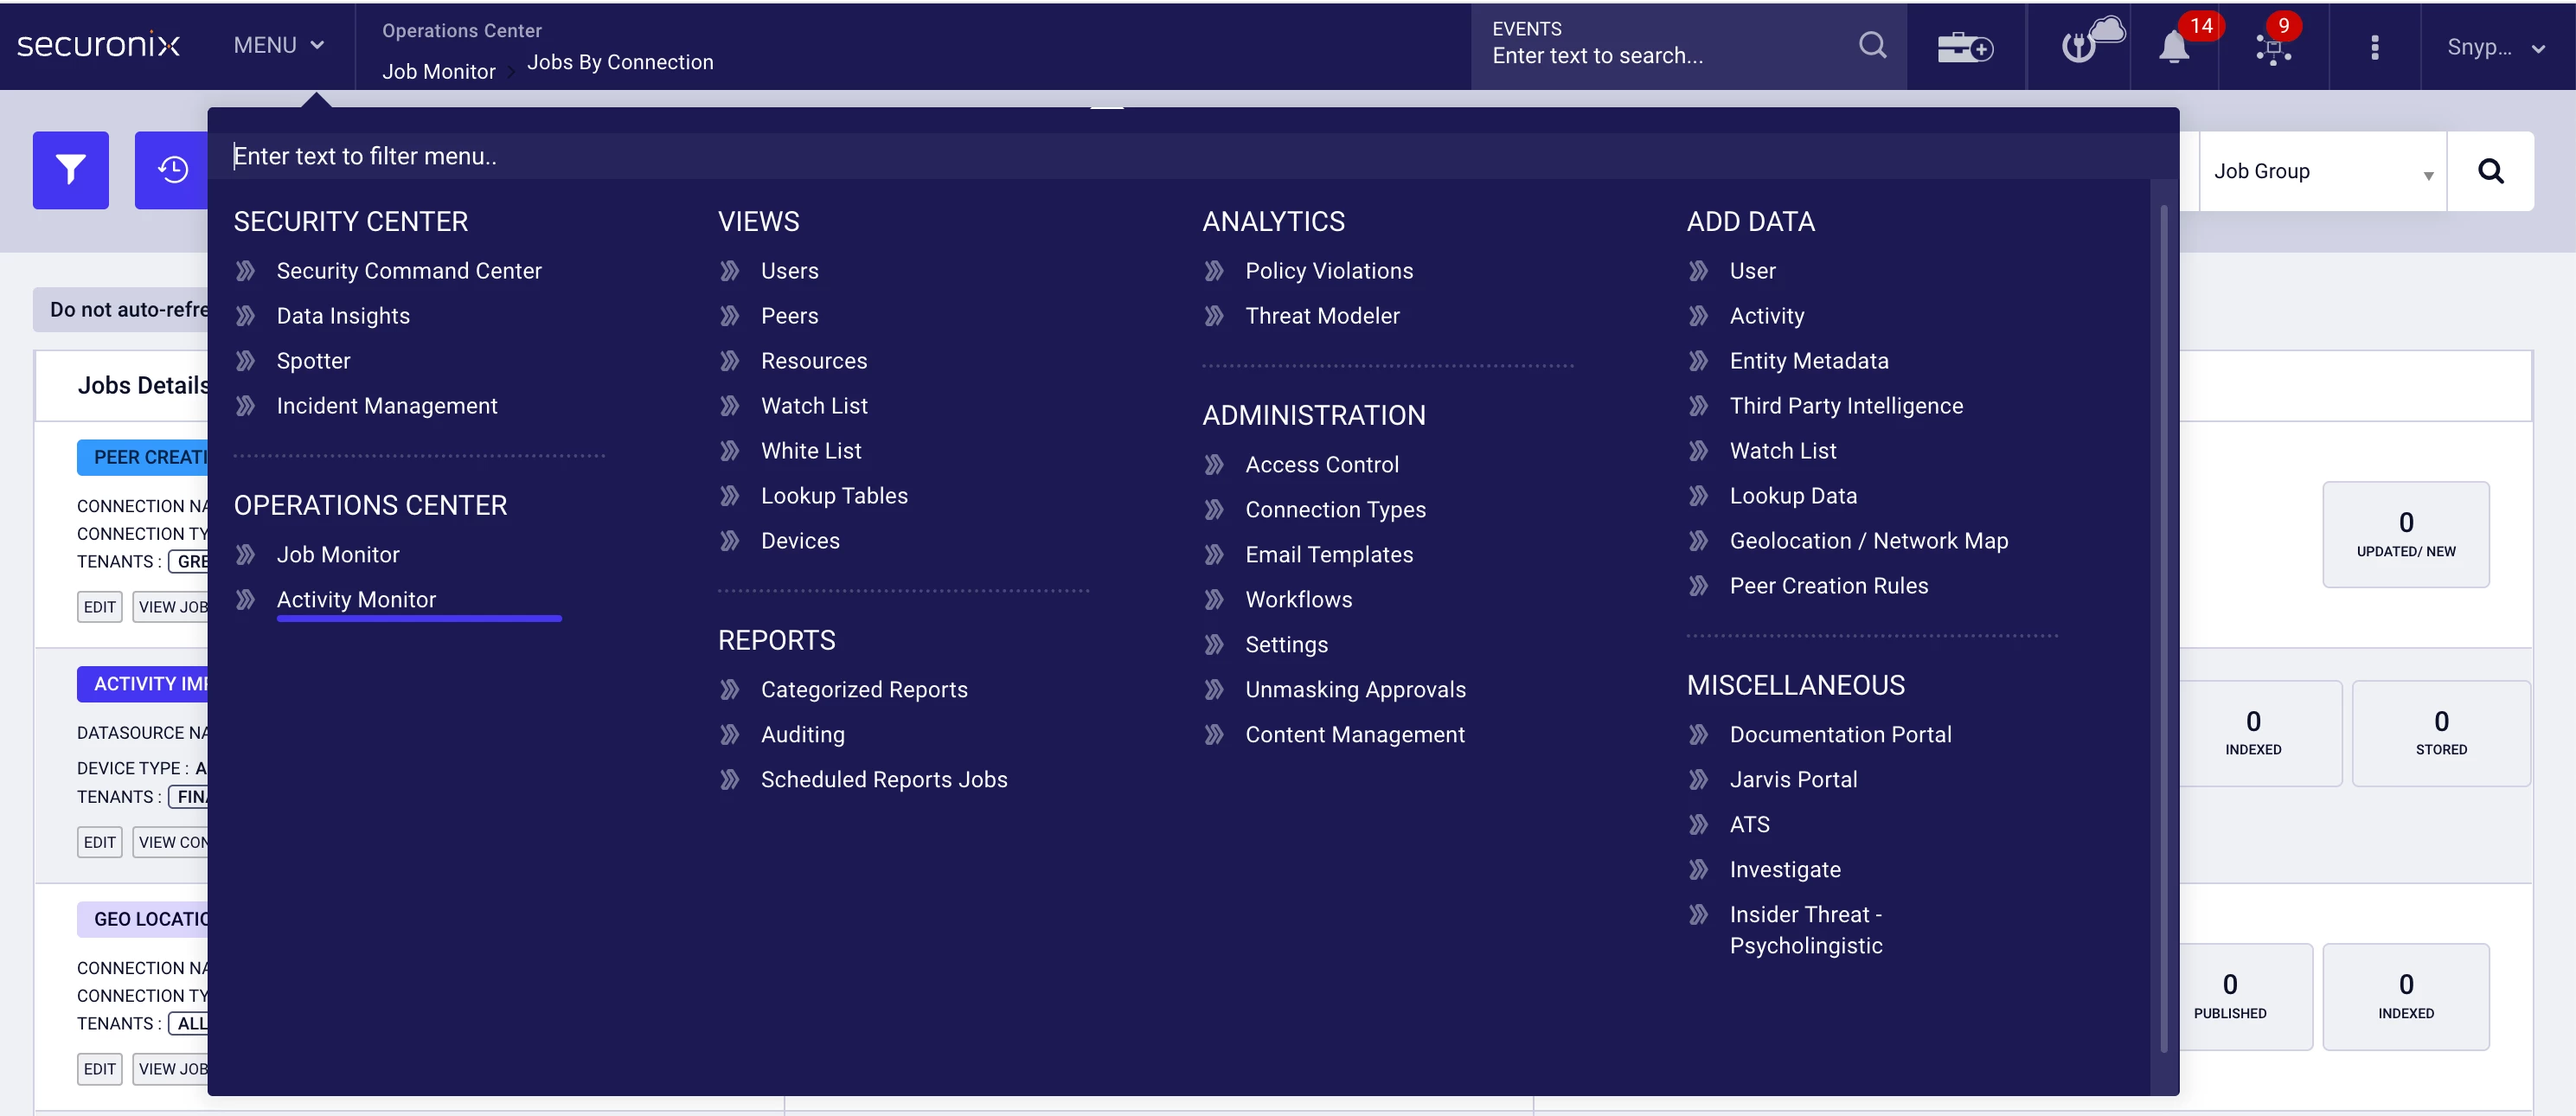
Product Module: Add Data → Activity | Operations Center → Job Monitor | Operations Center → Activity Monitor
Last Updated: February 24, 2026
KB ID: KB-20260224-logs-not-appearing
Tags: ingestion, logs not showing, datasource troubleshooting, job monitor, activity monitor, syslog, API ingestion, pull-based ingestion, push-based ingestion, log pipeline
Problem
Logs from a configured datasource are not visible in Securonix. The datasource appears configured, but events are not searchable or dashboards show no recent activity.
Objective
This guide helps you:
-
Determine whether ingestion is functioning
-
Identify whether the issue is credential-related, configuration-based, upstream delivery, or infrastructure-related
-
Resolve common ingestion issues without opening a support case
-
Collect the correct information if escalation is required
⏱️ 60-Second Quick Check
Before beginning deeper troubleshooting:
-
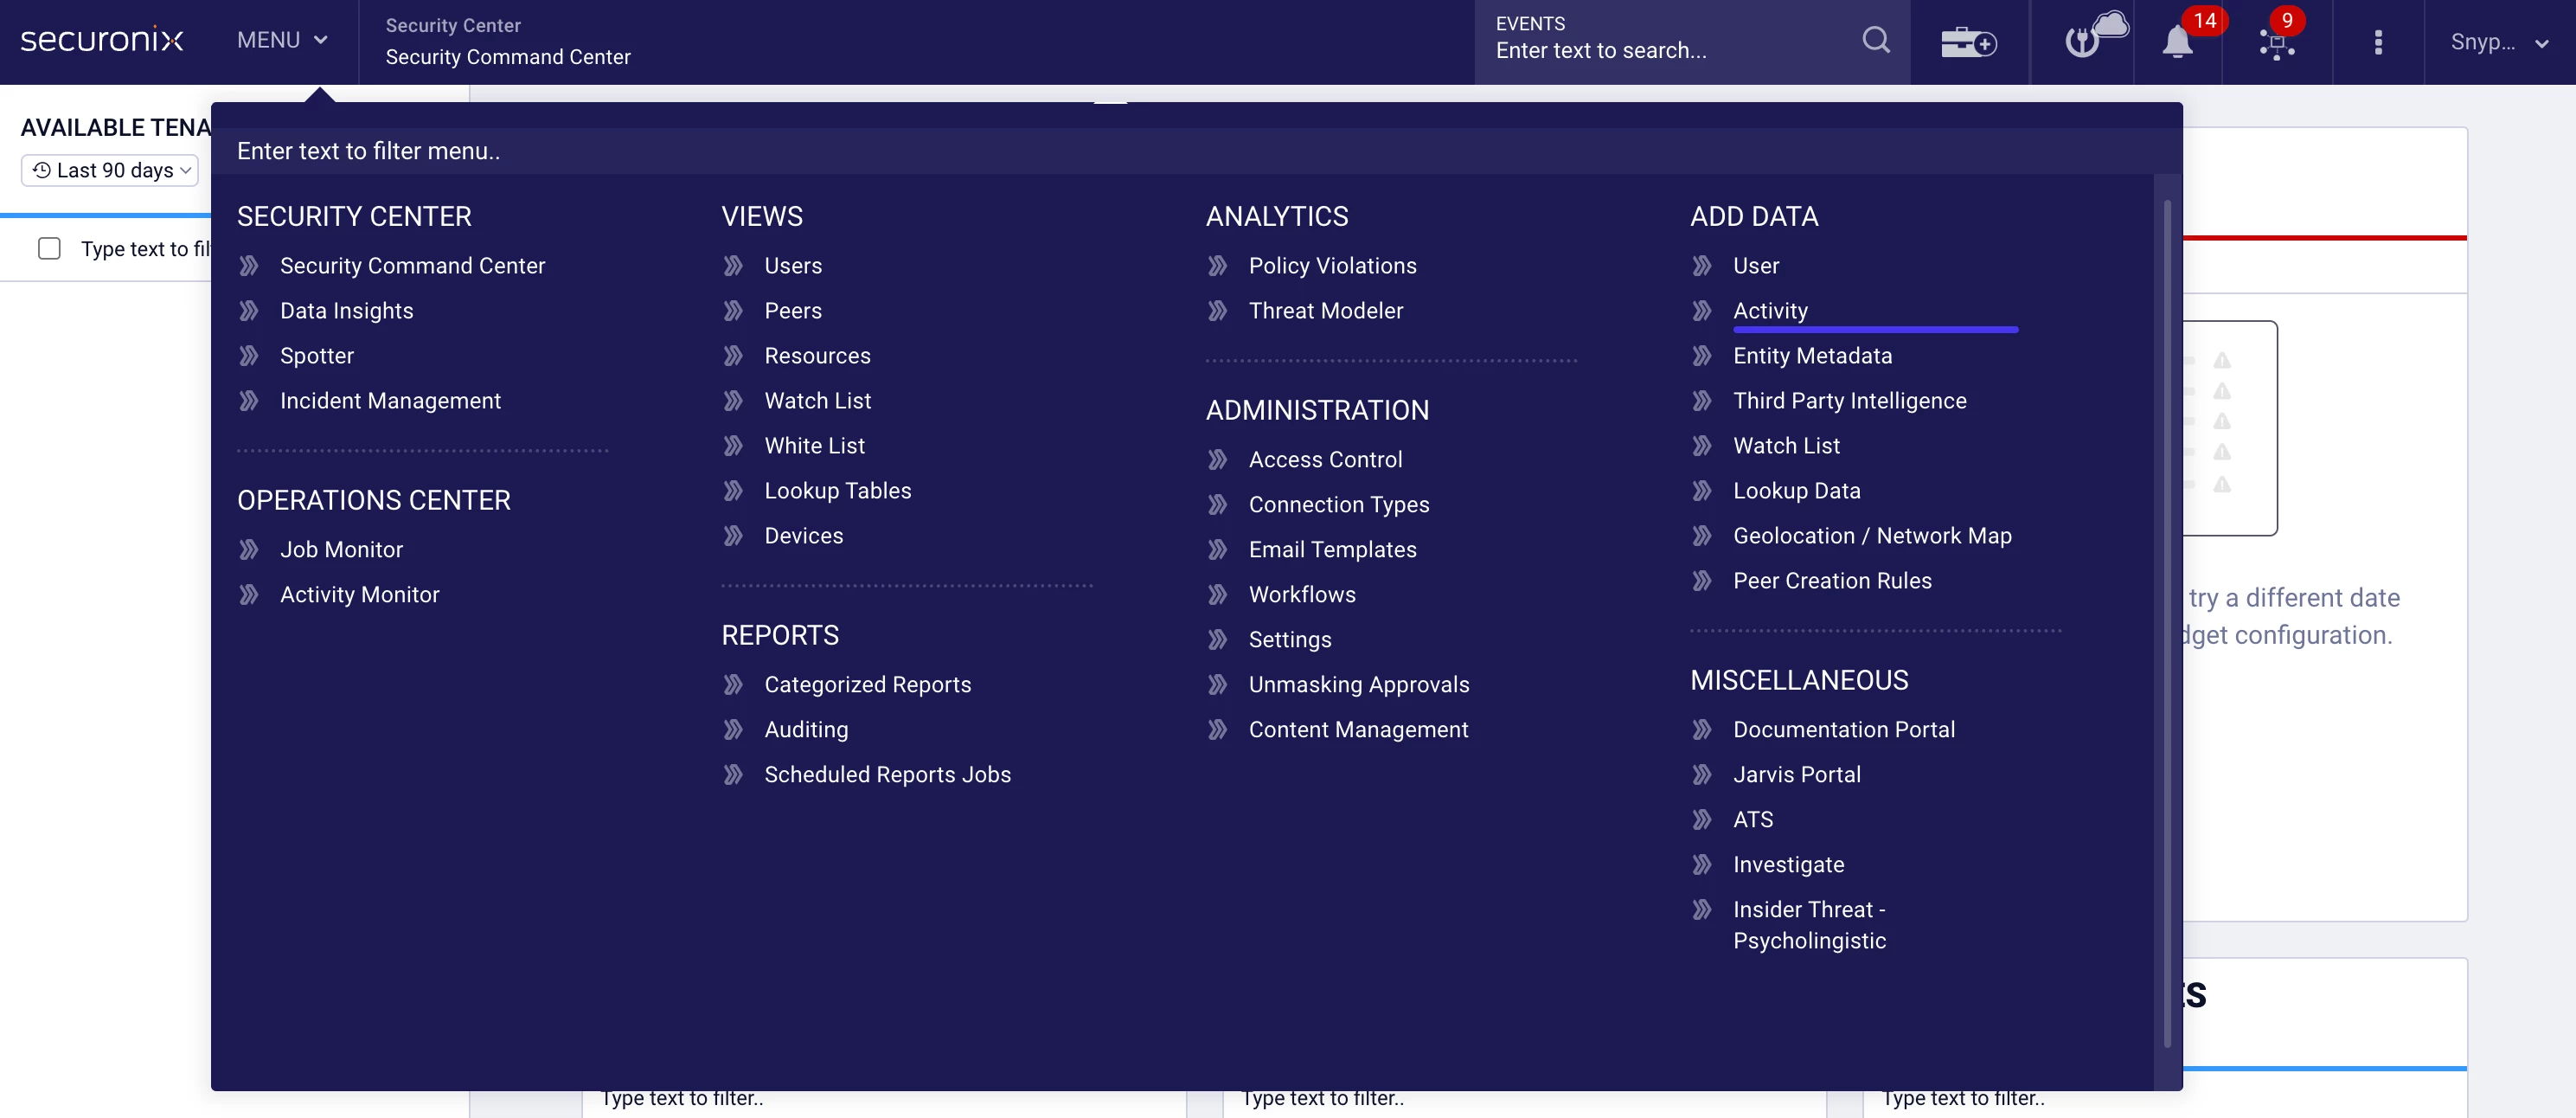
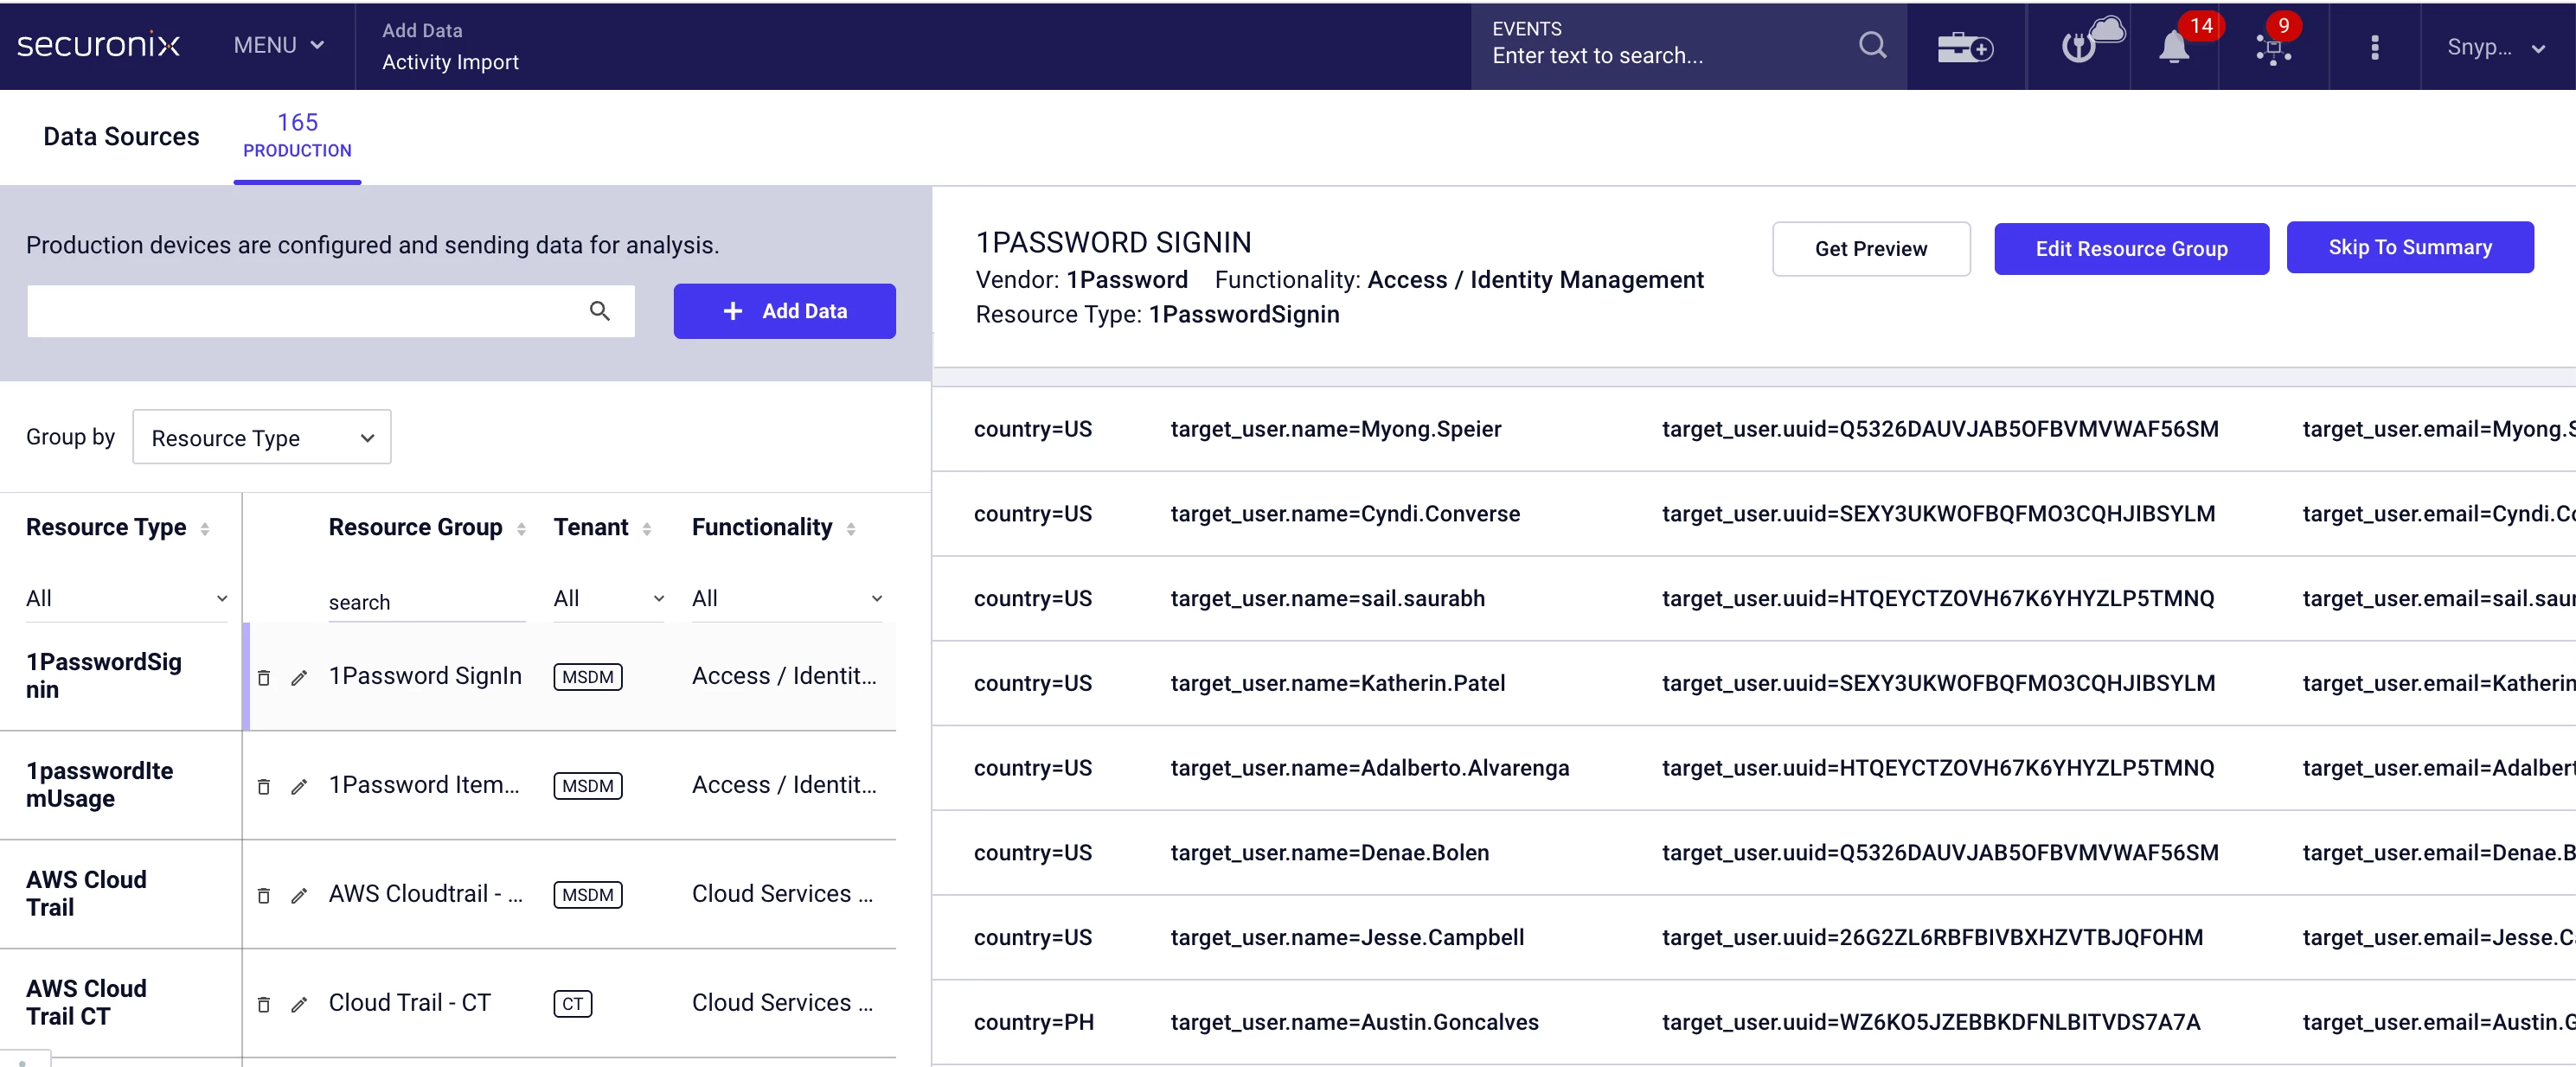
Navigate to MENU → Add Data → Activity.
- Open the datasource.
- Review:
-
Last Run
-
Last Success
-
Last Event Time
-
Interpretation
Recent timestamps present → Ingestion is likely working.
-
Expand your search time range.
-
Confirm filters and datasource selection.
Timestamps outdated or blank → Continue with the troubleshooting steps below.
🧭 Step 1: Identify the Ingestion Type
In MENU → Add Data → Activity, review the datasource configuration.
Choose the troubleshooting path that matches your configuration.
🔄 Section A: Pull-Based (API or Database Sources)
Securonix retrieves data from the external system.
🔎 Indicators
-
Client ID / Client Secret
-
OAuth Token
-
Tenant ID
-
API URL
-
JDBC URL
-
Database credentials
Examples include:
-
Microsoft 365
-
Okta
-
Azure AD
-
AWS CloudTrail (API mode)
-
ServiceNow
-
Database ingestion (JDBC)
📋 Check Job Status
-
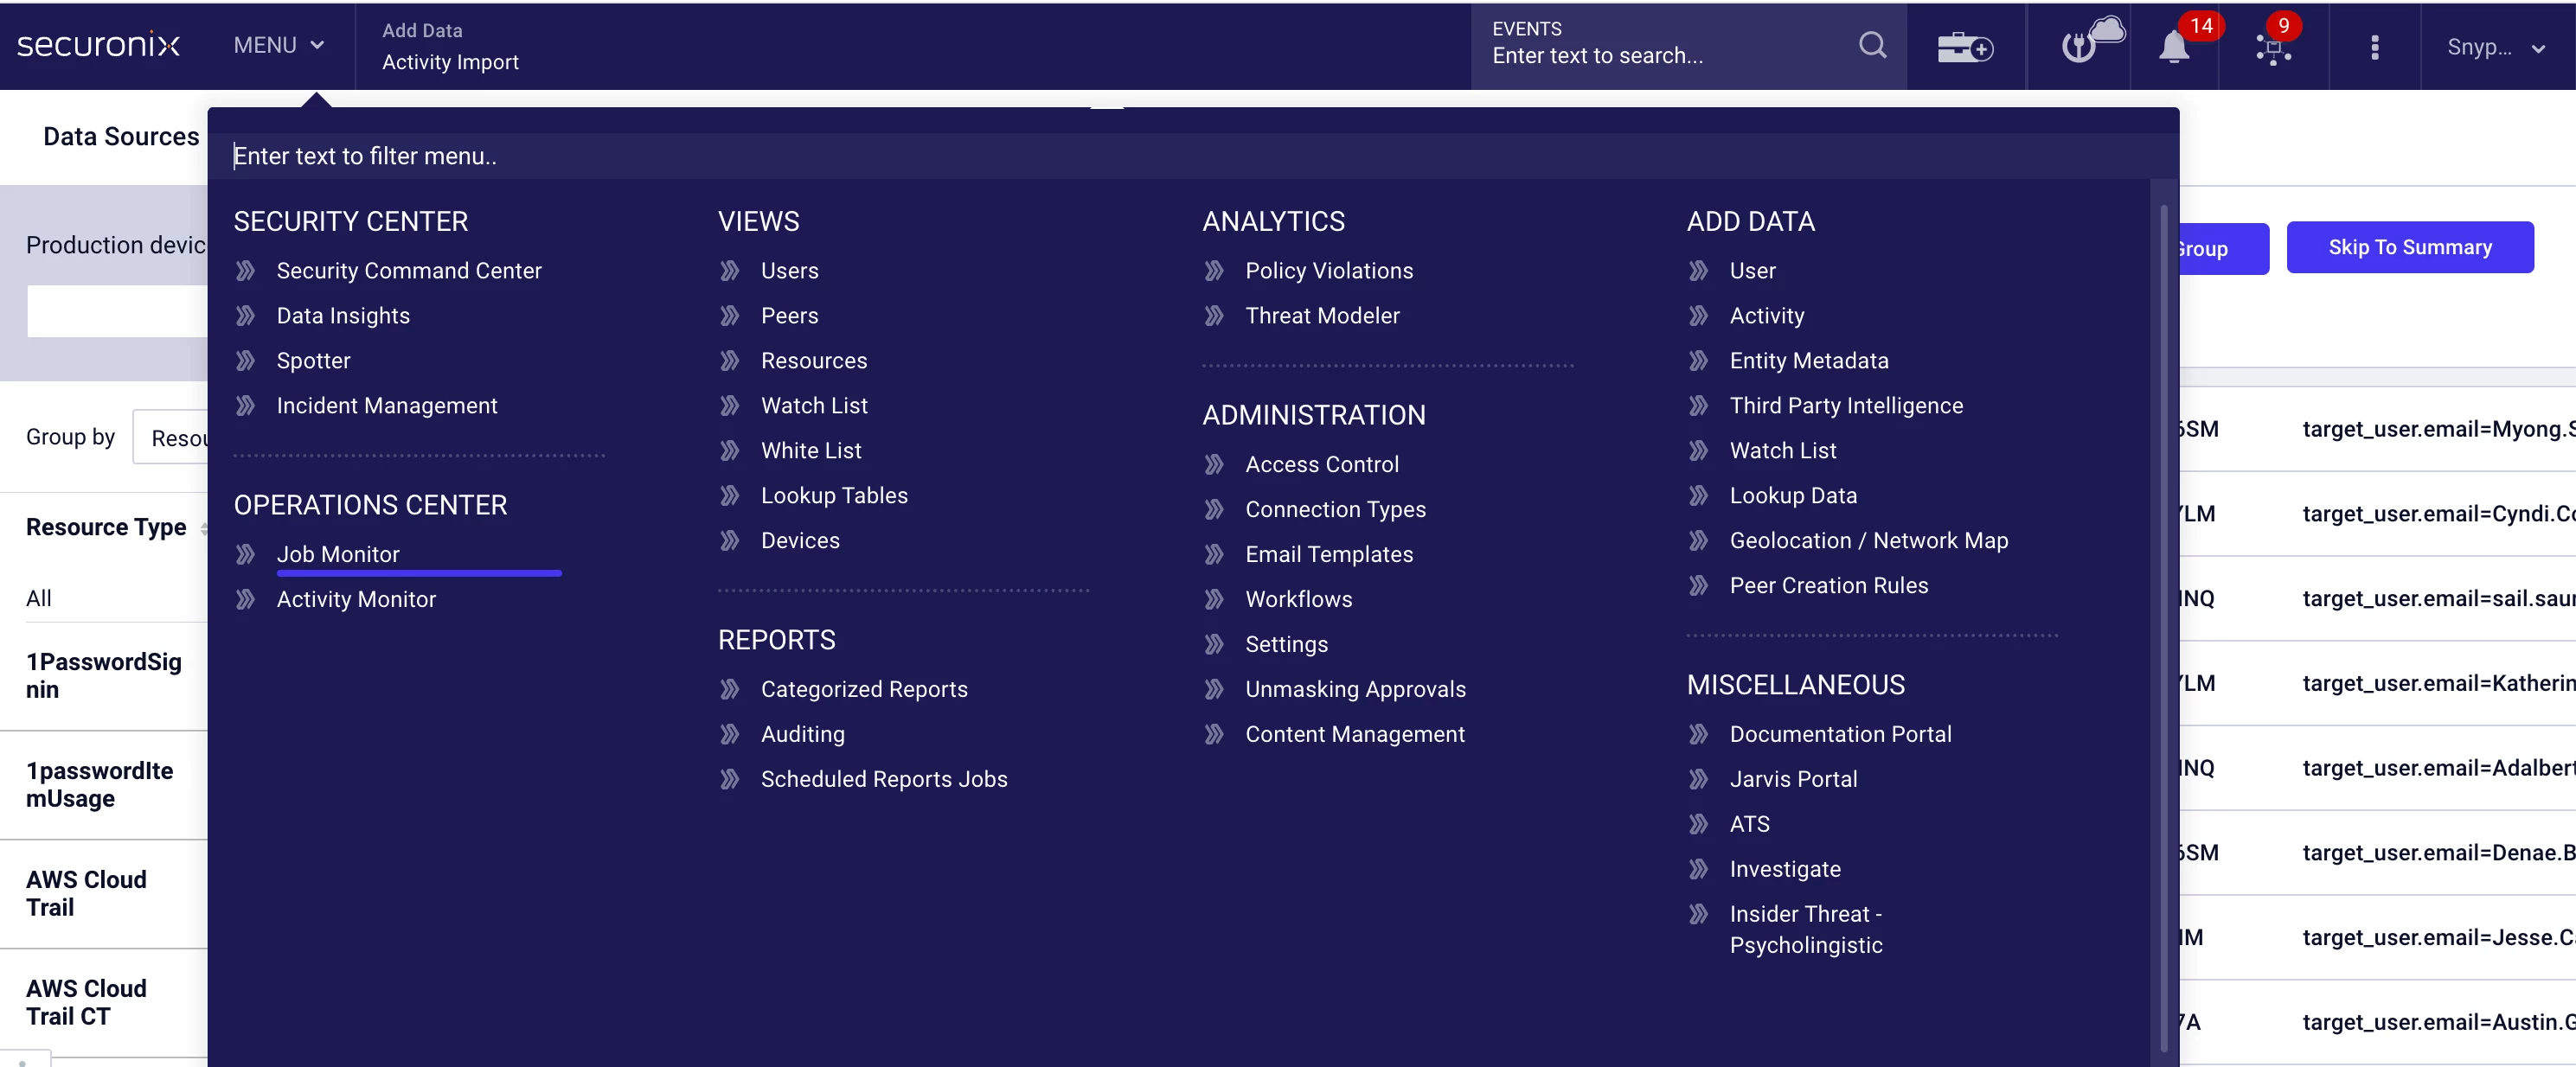
Navigate to MENU → Operations Center → Job Monitor.
- Locate jobs associated with the datasource.
- Review the latest execution status and error messages.
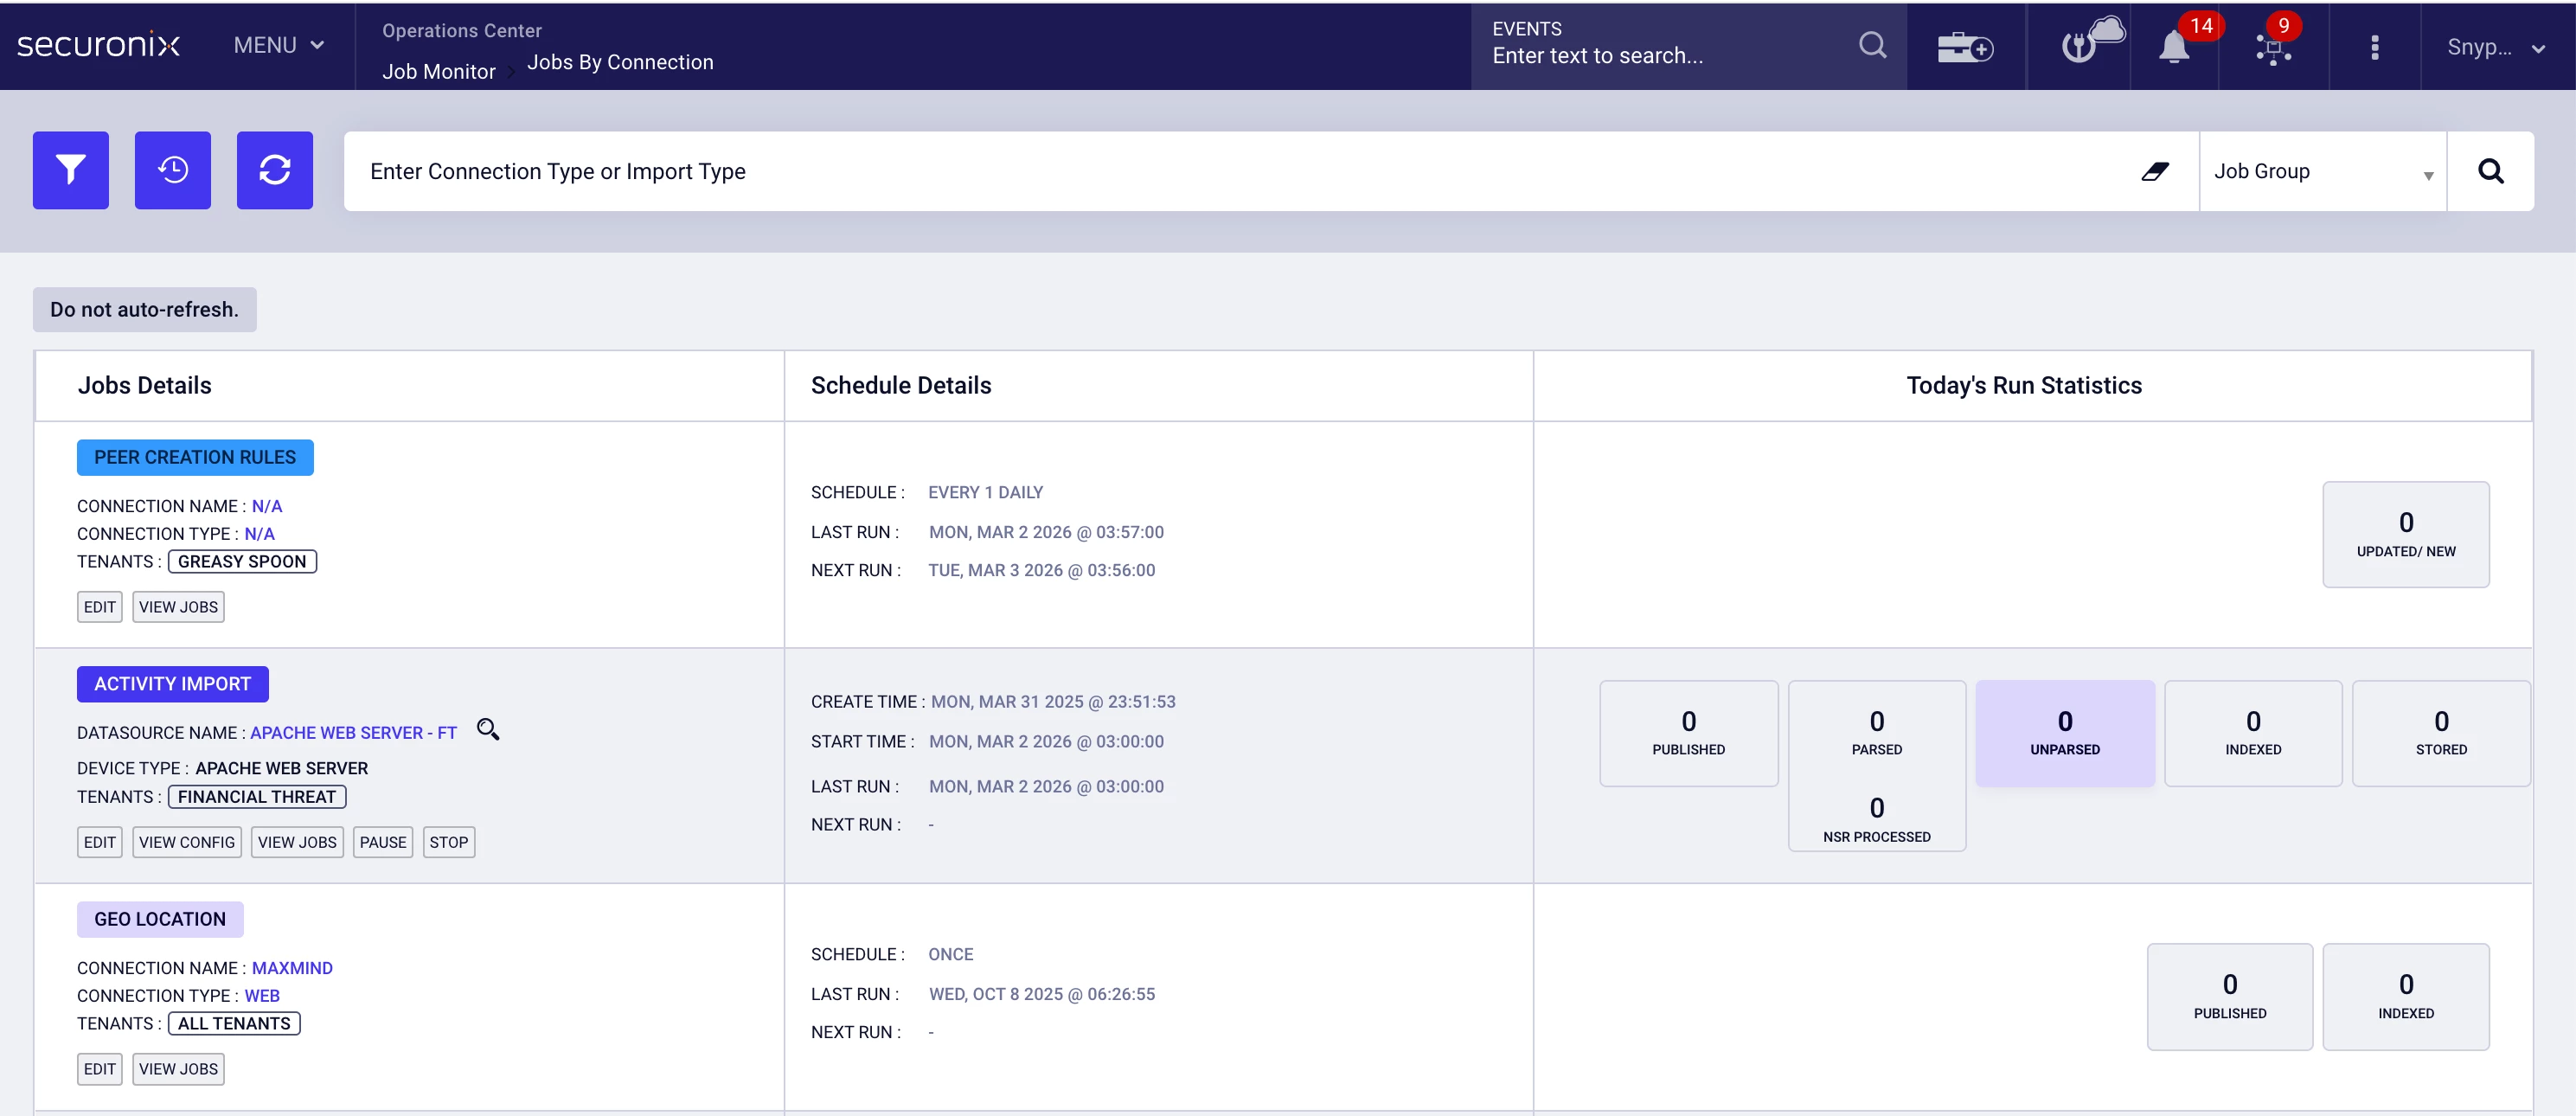
🚨 Common Error Messages
-
401 Unauthorized
-
Invalid access token
-
Token expired
-
403 Forbidden
-
Insufficient privileges
-
Login failed for user
-
Connection refused
-
Timeout while connecting
🧠 What These Errors Typically Indicate
-
Expired or rotated credentials
-
Revoked permissions
-
Incorrect tenant or account configuration
-
Network or firewall restrictions
-
API endpoint changes
🛠️ Validate and Re-Save Configuration
-
Return to MENU → Add Data → Activity.
-
Re-enter credentials.
-
Confirm permissions directly in the source platform.
-
Save the configuration.
-
Monitor Job Monitor for successful execution.
✅ Expected Result
The job completes successfully without authentication or connectivity errors.
📡 Section B: Push-Based (Syslog or Forwarded Logs)
Your source system sends logs to Securonix.
🔎 Indicators
-
Syslog Port
-
Protocol (UDP/TCP)
-
Device IP
-
Ingestion Node
Examples include:
-
Palo Alto Firewall
-
Fortinet
-
Linux syslog
-
IDS/IPS
-
Network devices
🕒 Review Last Event Time
-
Navigate to MENU → Add Data → Activity.
-
Review the Last Event Time.
Interpretation
Recent timestamp → Ingestion is active.
Outdated timestamp → Logs are not reaching Securonix.
🔍 Common Causes
-
Firewall rule changes
-
Syslog destination IP modification
-
Firmware upgrade resetting logging configuration
-
Network routing changes
-
Log forwarding disabled on source device
🎯 If Only One Source Is Impacted
-
Review upstream device configuration.
-
Confirm destination IP and port settings.
-
Verify logging is enabled.
🏗️ If Multiple Sources Stopped Simultaneously
-
Navigate to MENU → Operations Center → Activity Monitor.
-
Review ingestion activity across all sources.
🚨 Possible Infrastructure Indicators
-
No space left on device
-
Pipeline initialization failures
-
Kafka broker unavailable
-
Failed to bind to port
If ingestion activity is absent across multiple sources, verify ingestion services are running and system resources (such as disk space) are sufficient.
💡 Common Scenario: Ingestion Is Working but Data Is Not Visible
In some cases, ingestion is functioning correctly, but data appears missing due to:
-
Incorrect time range
-
Filters applied in search
-
Wrong datasource selection
Before escalating, expand the time range and confirm the correct datasource is selected.
⚠️ When to Contact Securonix Support
If the issue persists after completing the steps above, include:
-
Datasource name
-
Screenshot of Add Data → Activity
-
Screenshot of Job Monitor
-
Screenshot of Activity Monitor
-
Exact error message (copy text if possible)
-
Approximate time ingestion stopped
Providing this information significantly reduces resolution time.
✅ Verification Checklist
Confirm the following before closing the investigation:
-
Datasource shows recent Last Event Time
-
No authentication or connection errors in Job Monitor
-
Activity Monitor shows ingestion traffic
-
Credentials validated in the source platform
-
Logs visible in search with expanded time range
Expected Outcome
After completing this guide, you should be able to confidently determine whether ingestion is functioning, identify whether the issue is credential-based, upstream-related, or infrastructure-related, and decide whether escalation is required.
If this guide helped resolve your issue, consider sharing feedback in the comments to support other community members.