

Audience: Securonix Administrators, Security Engineers, MSSPs
Product Module: Securonix Hub, Activity Import, Job Monitor, Spotter
Article Type: Troubleshooting Guide
Last Updated: October 21, 2026
Tags: Securonix Hub, Missing Logs, Collection, Datasource, Connectivity, Troubleshooting
What this guide helps you determine
When expected events stop appearing in Spotter, determine whether one datasource has stopped or several datasources assigned to the same Hub are affected. Then use current Hub status and collection results to choose a source-specific correction or request help resolving a shared Hub problem. Start at Step 1.
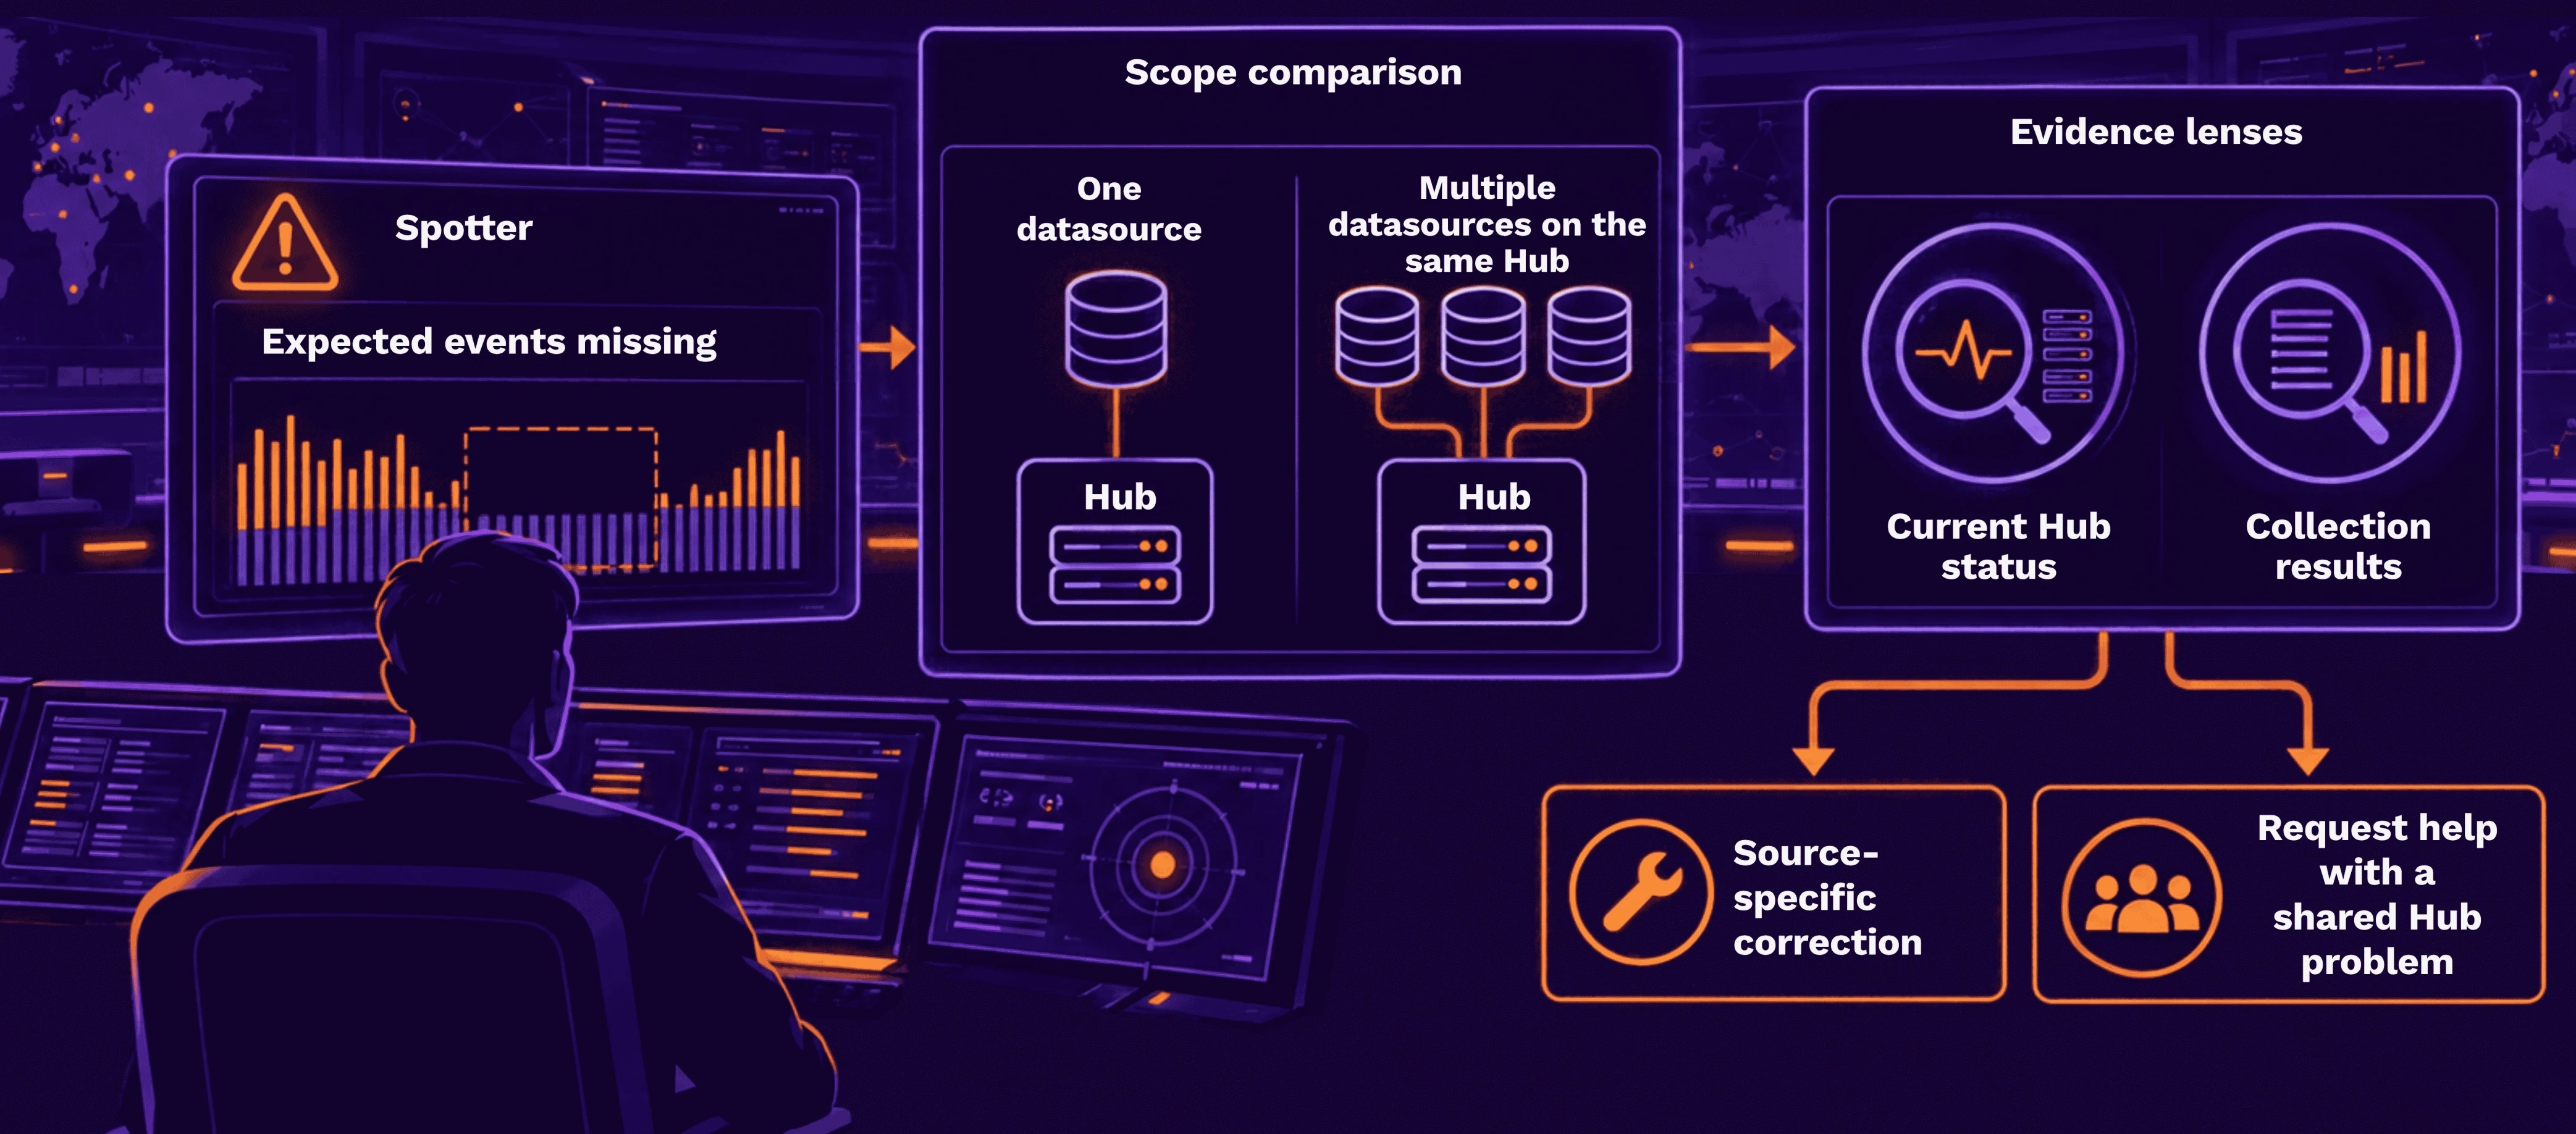
Both customer-managed and Securonix-managed Hub users can perform the available application checks. Host-level service repair and platform connection diagnostics are handled by the responsible administrator or Support when those checks identify the need.
What you need to start
Have the name of one affected datasource and access to its tenant. You will use Activity Import, Spotter, and the Hub/ingestion monitoring view available in your deployment. If a view is unavailable, ask your tenant administrator to assist with that step.
You will identify the Hub, compare event times, and record any displayed error as you follow the instructions. No separate preliminary investigation is required.
Step 1 Identify the Hub and another datasource assigned to it
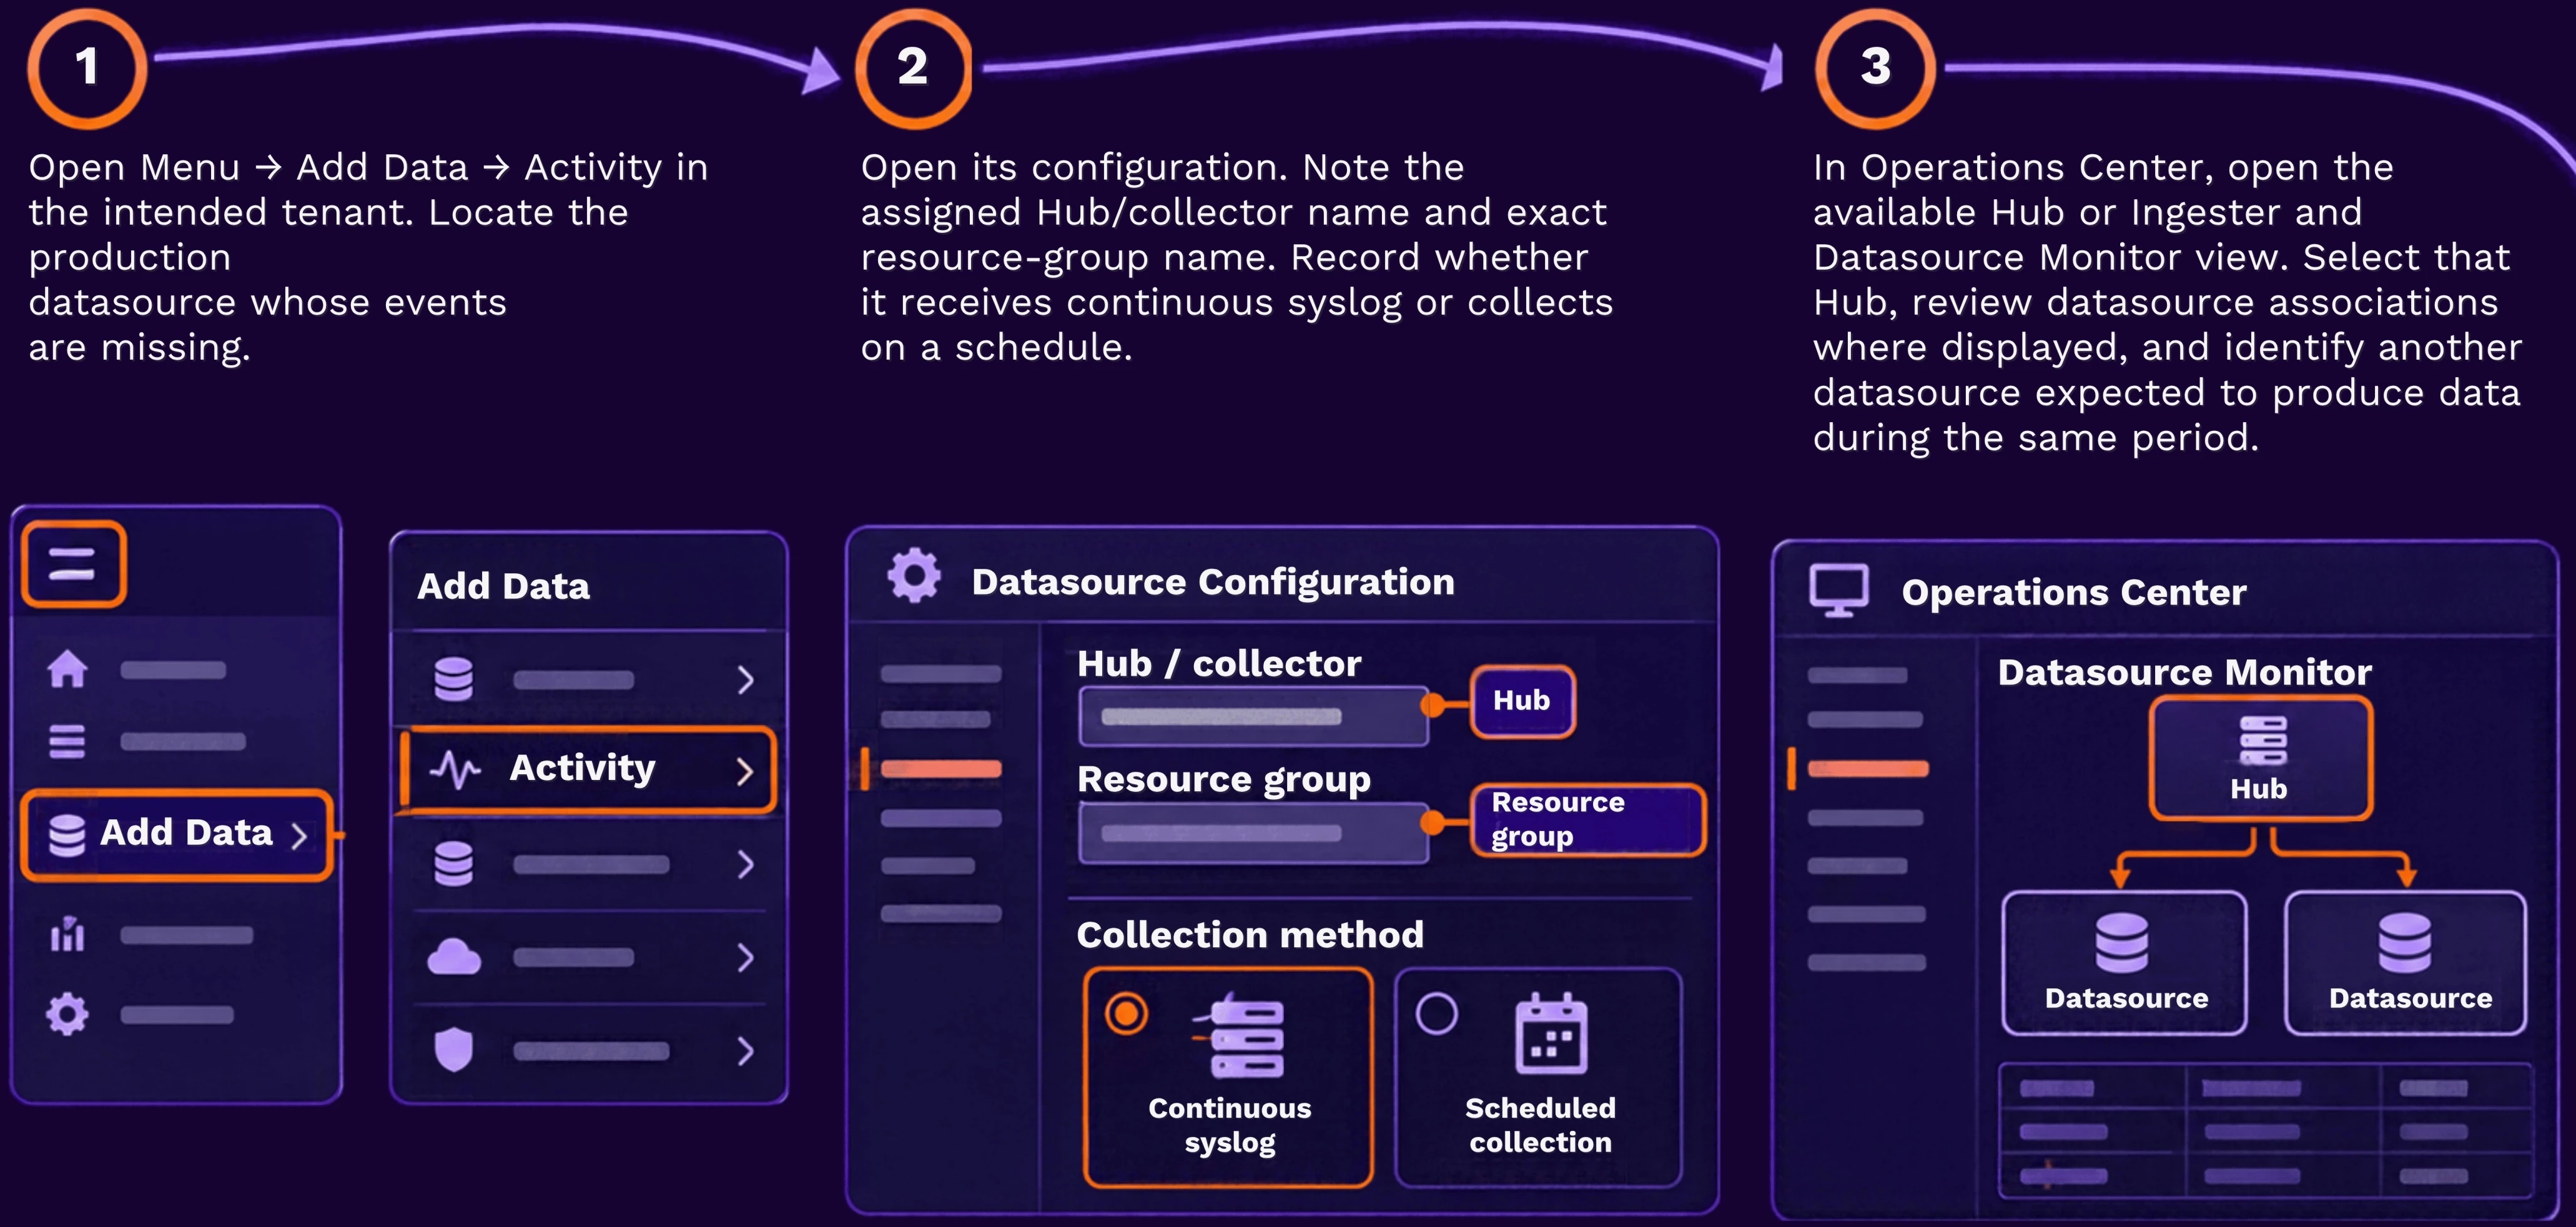
If the monitor does not display datasource associations, check the Hub assignment on another production datasource in Activity Import, or have the datasource administrator confirm the mapping. Do not infer a shared Hub from similar datasource names.
Example: The affected group is Branch_Firewalls. Its configuration identifies Hub-East. A second datasource, Cloud_Audit, is also assigned to Hub-East and has an hourly collection schedule.
Next: Continue to Step 2 for both groups. If this Hub has only one active datasource, test that datasource and select the “No comparison available” outcome in Step 2.
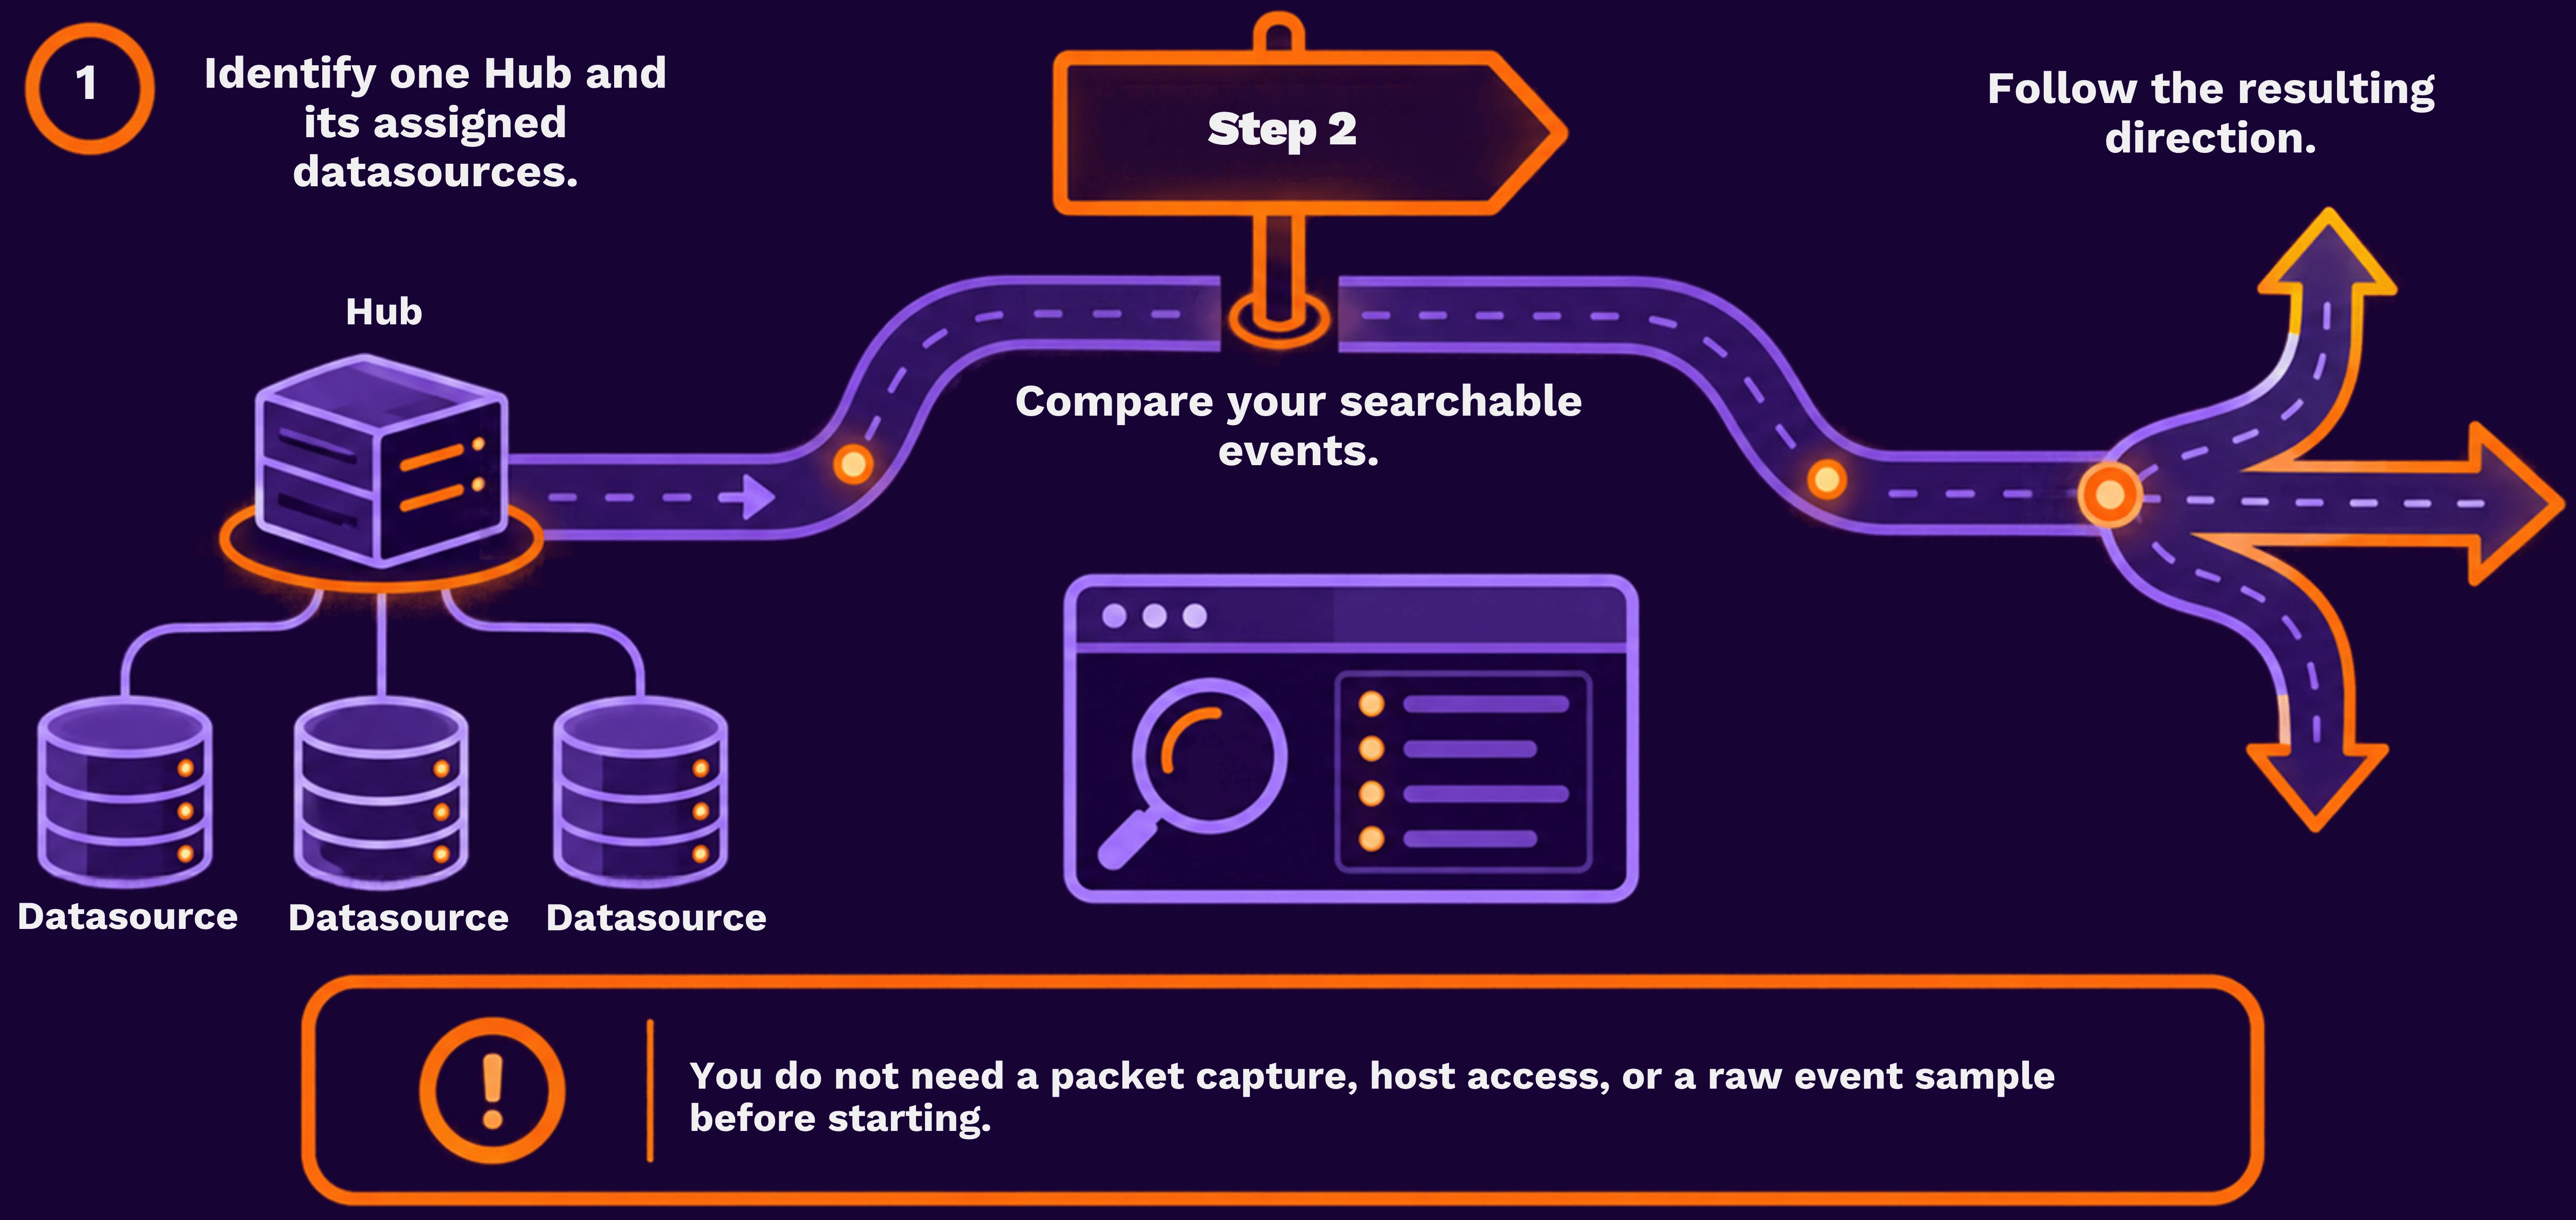
Step 2 Check when each datasource last produced searchable events
This step establishes what you can find in Spotter. It does not search for a failure or assume that an event timestamp is the time the Hub received it.
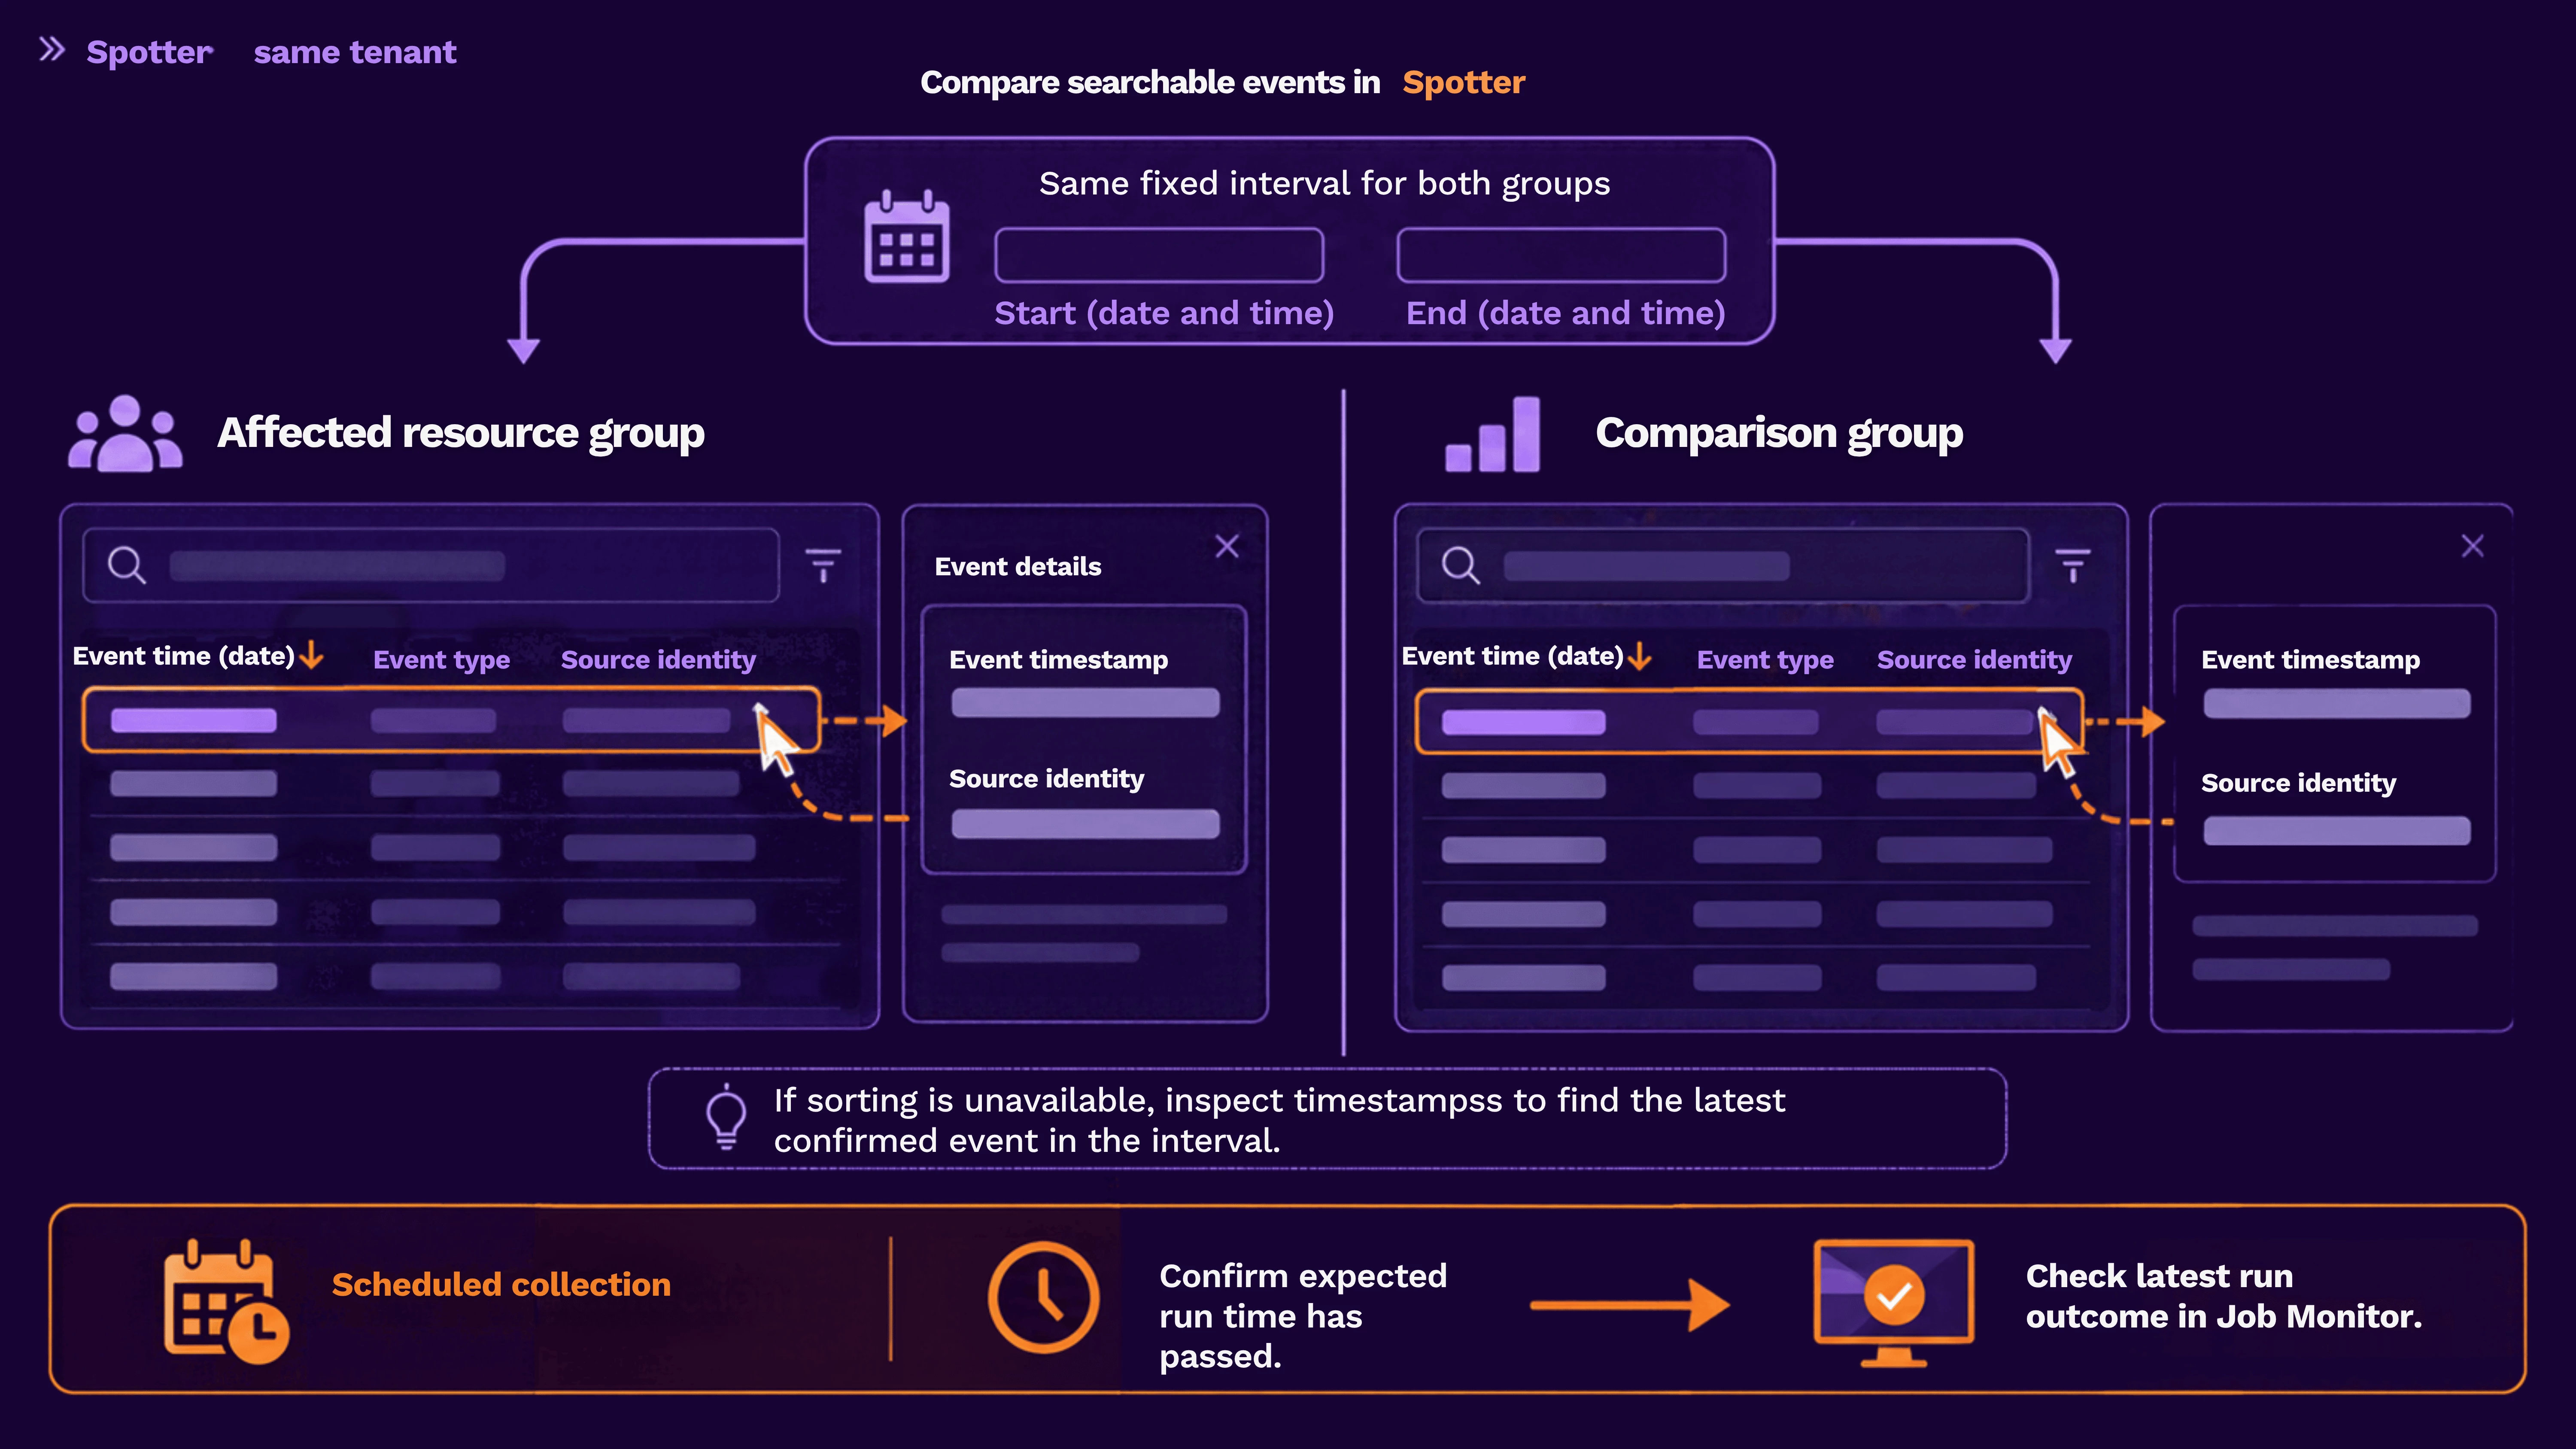
- Open Spotter in the same tenant. Select a fixed recent interval that includes the period when data was expected—for example, the last four hours for sources normally active within that period. Record its start/end times and time zone.
- Run the group-specific query below. If results appear, use the event-time/date column's descending sort control where available and open the most recent result. Record its displayed event timestamp and source identity. If sorting is unavailable, inspect the result timestamps to identify the latest confirmed event in that interval.
- Repeat with the comparison group's name over the same interval. For scheduled collection, check that its expected run time has passed and confirm the latest run's outcome in Job Monitor.
First group:
index = activity
AND resourcegroupname = "Branch_Firewalls"
Comparison group:
index = activity
AND resourcegroupname = "Cloud_Audit"
Replace the names with the confirmed groups from Step 1. Avoid additional account or message filters during this comparison. If the interval returns no results, check one earlier fixed interval in which data was known to be present; record it separately.
| Group | What to record |
|---|---|
| Branch_Firewalls | Latest confirmed searchable event timestamp, query interval, and whether newer events were expected |
| Cloud_Audit | Same details, plus the latest scheduled run time/outcome where applicable |
Also record the time you first noticed the missing data. Keep that separate from the latest event's timestamp. Neither establishes the exact outage start or the last network receipt time. Incorrect source clocks or parsed time zones can also distort event timestamps.
| Comparison result | What to do next |
|---|---|
| One source has stopped; current events from the comparison source continue | Use the source-specific path below. A Hub-wide outage is less likely, although individual collection paths can still fail. |
| Several sources have no expected new events | Continue to Step 3 to inspect the shared Hub. |
| Both have current events, but the Hub status appears stale | Continue to Step 3 to check reporting freshness; do not treat the status alone as a collection outage. |
| No comparison source is available, or results are inconclusive | Continue to Step 3 with the observation from the affected source. |
If the problem is isolated to one datasource
Open that datasource's Activity Import configuration and follow the path for its collection method:
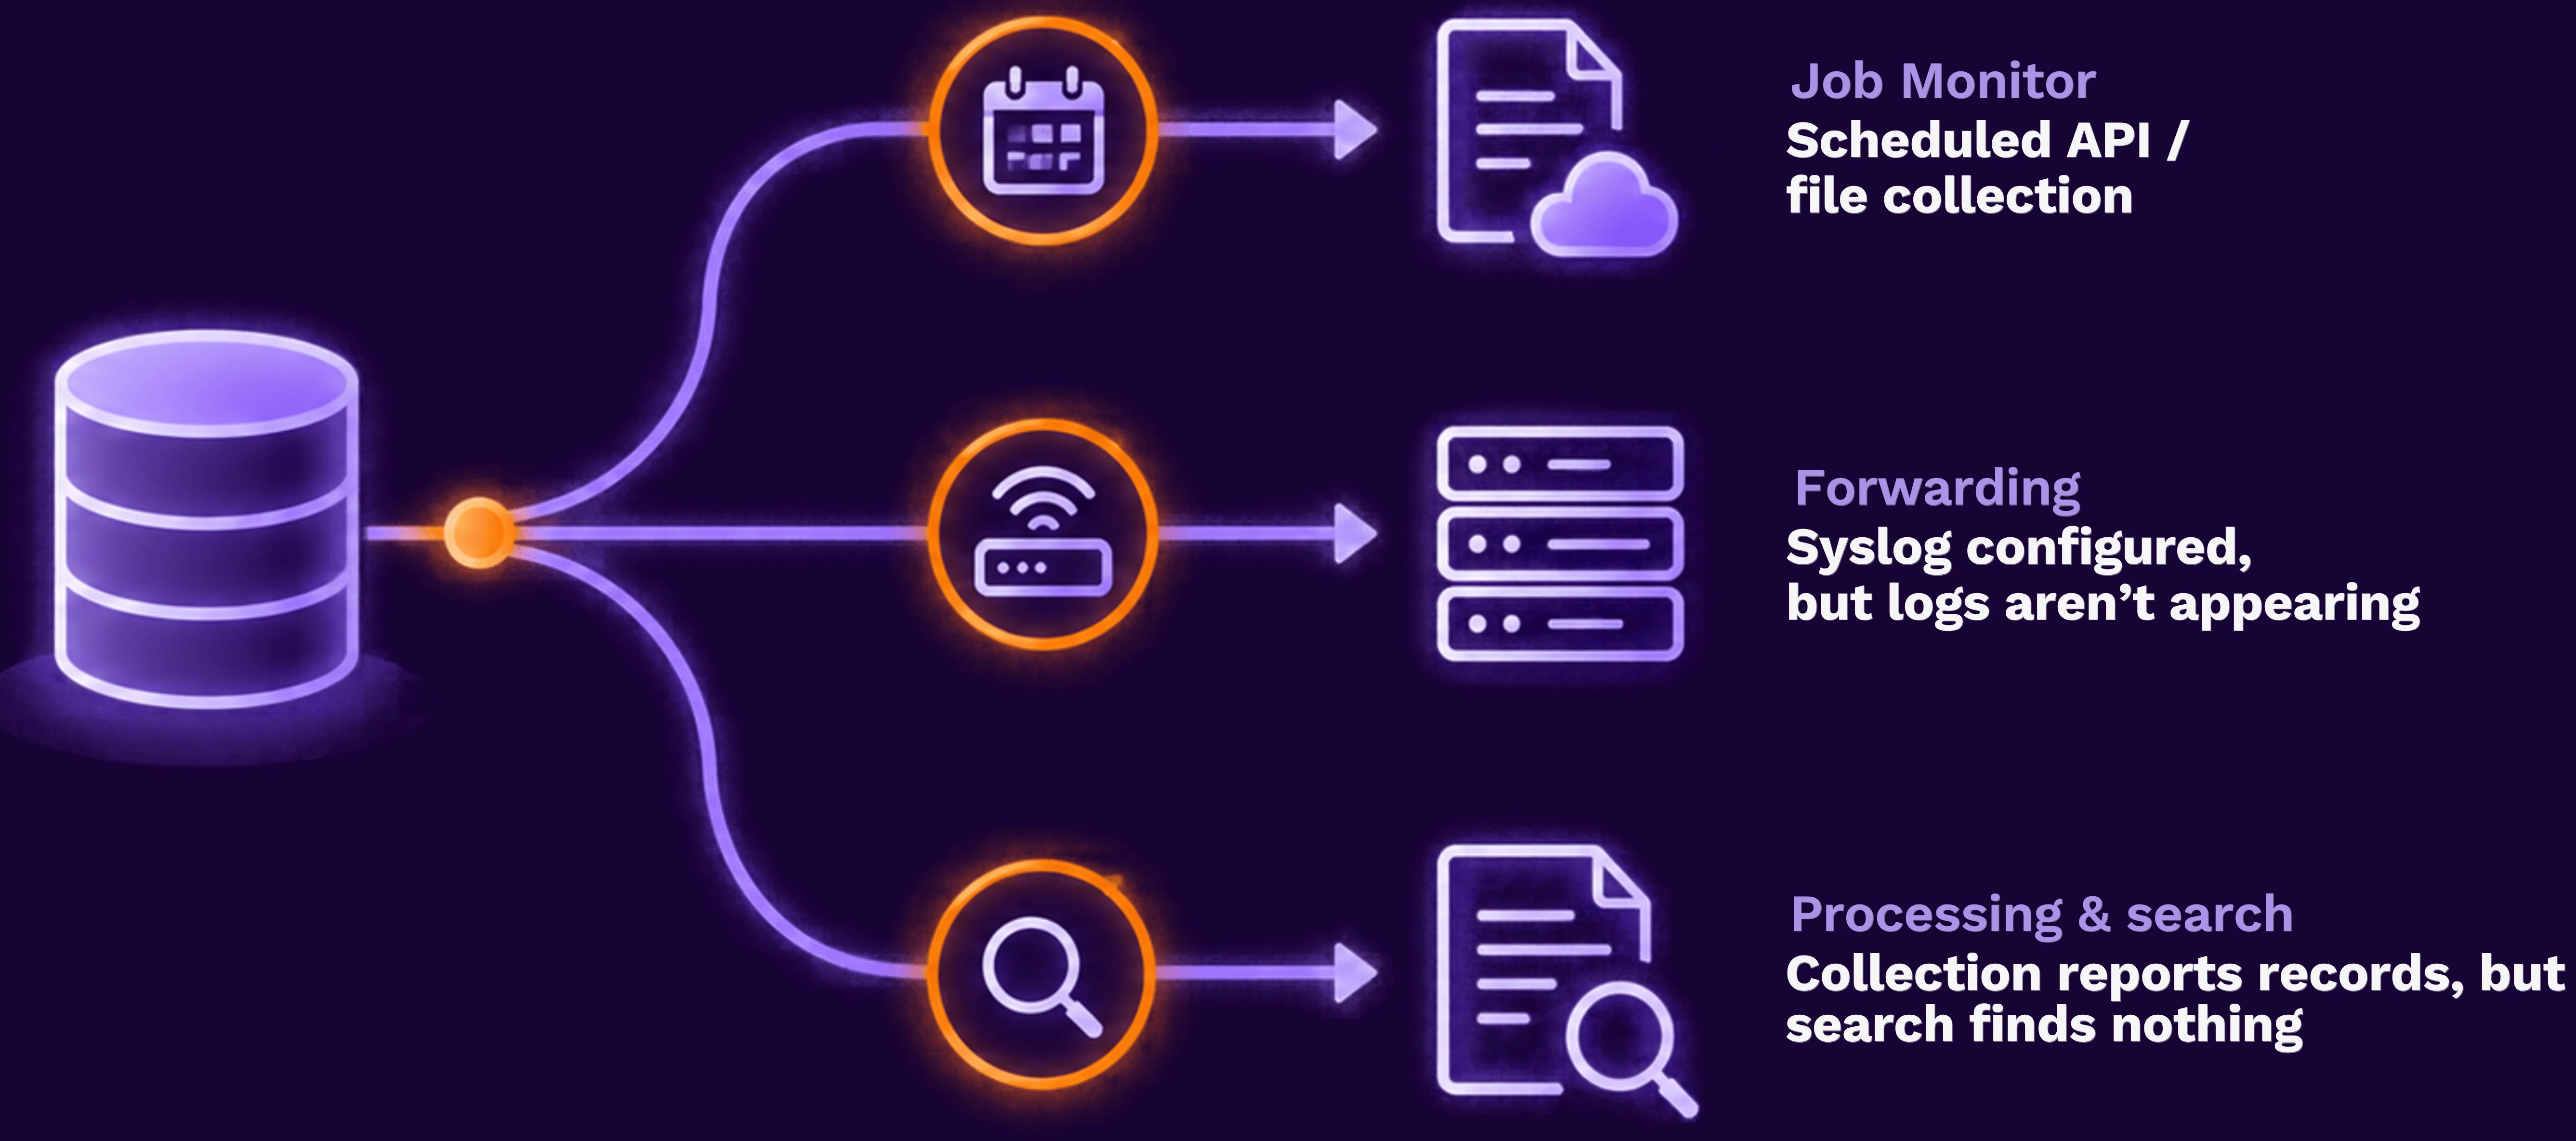
- Scheduled API/file collection: Find its recent execution in Job Monitor. If no run exists, verify its saved production schedule and Hub assignment.
- Syslog: Use Syslog Is Configured, but Logs Aren’t Appearing in Securonix to check sender forwarding, Hub receipt, and datasource assignment.
- Collection reports records but search finds nothing: Follow Missing or Delayed Events in Securonix? Troubleshoot Collection and Ingestion for processing and search validation.
Complete the relevant correction in that guide, then return to Step 4 here to verify continued arrival. You do not need to perform the shared-Hub checks below unless new findings implicate the Hub or another datasource becomes affected.
Step 3 Check the Hub status and the error actually reported
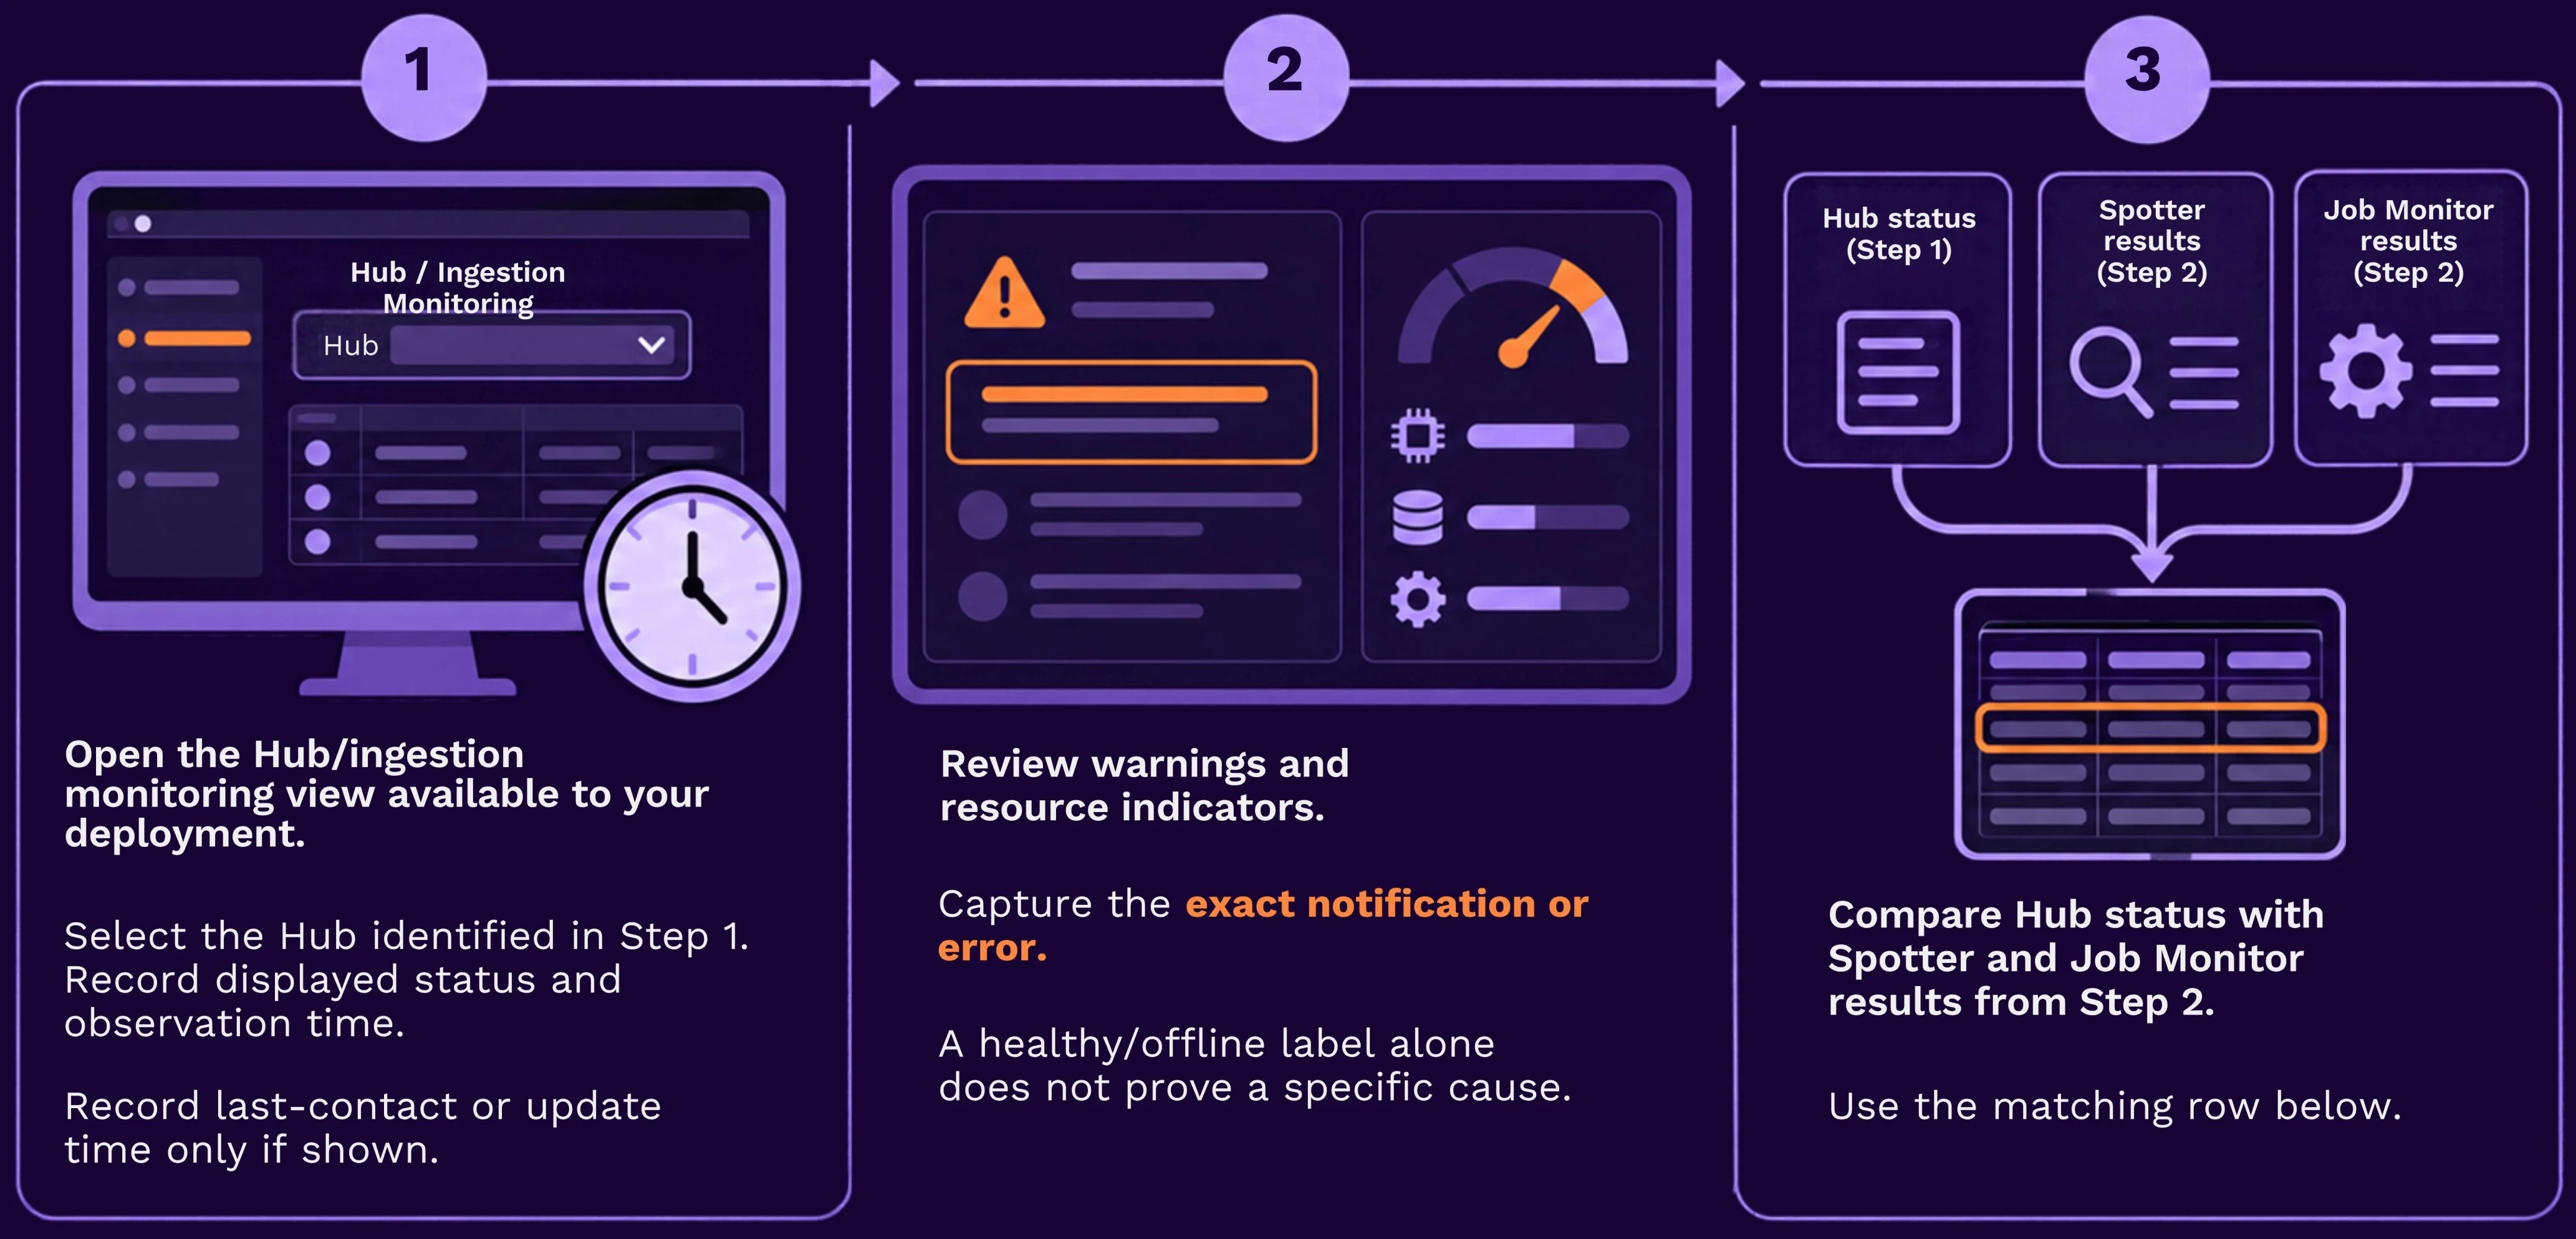
| What you can establish | Next action |
|---|---|
| Hub status is offline/stale and multiple sources have stopped | Check known maintenance and recent network/proxy changes with the Hub owner. If no applicable correction is identified, open a Support case to restore Hub communication and collection. |
| Hub is current, but several expected collections fail or remain queued | Open the affected executions in Job Monitor and capture their exact errors. Request Hub/shared-collection investigation from the responsible administrator or Support. |
| Current events continue while Hub status is stale | Report the status/update discrepancy with the current event times. Request help fixing monitoring/management visibility rather than describing all ingestion as stopped. |
| A specific resource warning is displayed | Give the warning and affected interval to the Hub owner for the documented capacity/recovery procedure. For a managed Hub, include it in the Support case. |
| Hub and collection show progress, but events remain absent | Continue with the collection-and-ingestion companion guide to investigate processing and searchability. |
When a connection error identifies a specific destination
There is no general “test connectivity” action in this workflow. Use these checks only if a current job or Hub message names a failing connection. Record its destination and direction: Hub to source or Hub to Securonix platform.
| Displayed error | Specific action |
|---|---|
| DNS/name-resolution error | Verify the configured hostname against the datasource/deployment configuration. Have the network or Hub owner check resolution from that actual Hub environment. |
| Connection timeout or refusal | Verify the named destination and configured port. Have the network/Hub owner check that route and any applicable firewall/proxy rule. |
| TLS/certificate error | Give the endpoint and exact error to the responsible owner to check certificate validity, hostname, trust, and recent TLS inspection changes. |
| Authentication, expired token, or permission error for one source | Use the connector's credential/permission procedure. This error does not by itself establish a Hub network failure. |
A test from an analyst's laptop does not establish the route used by the Hub. For Securonix-managed components, complete the configuration and UI checks above, then open a Support case for help diagnosing and correcting the failed connection. You are requesting resolution, not backend access or a separate evidence-gathering exercise.
For customer-managed Hubs, the host/network administrator may perform the deployment's documented diagnostics and corrective action. This article does not require shell commands, queue changes, reinstalls, or exploratory service restarts.
Next: After the identified correction or Support-assisted recovery, continue to Step 4.
Step 4 Verify that normal collection has resumed
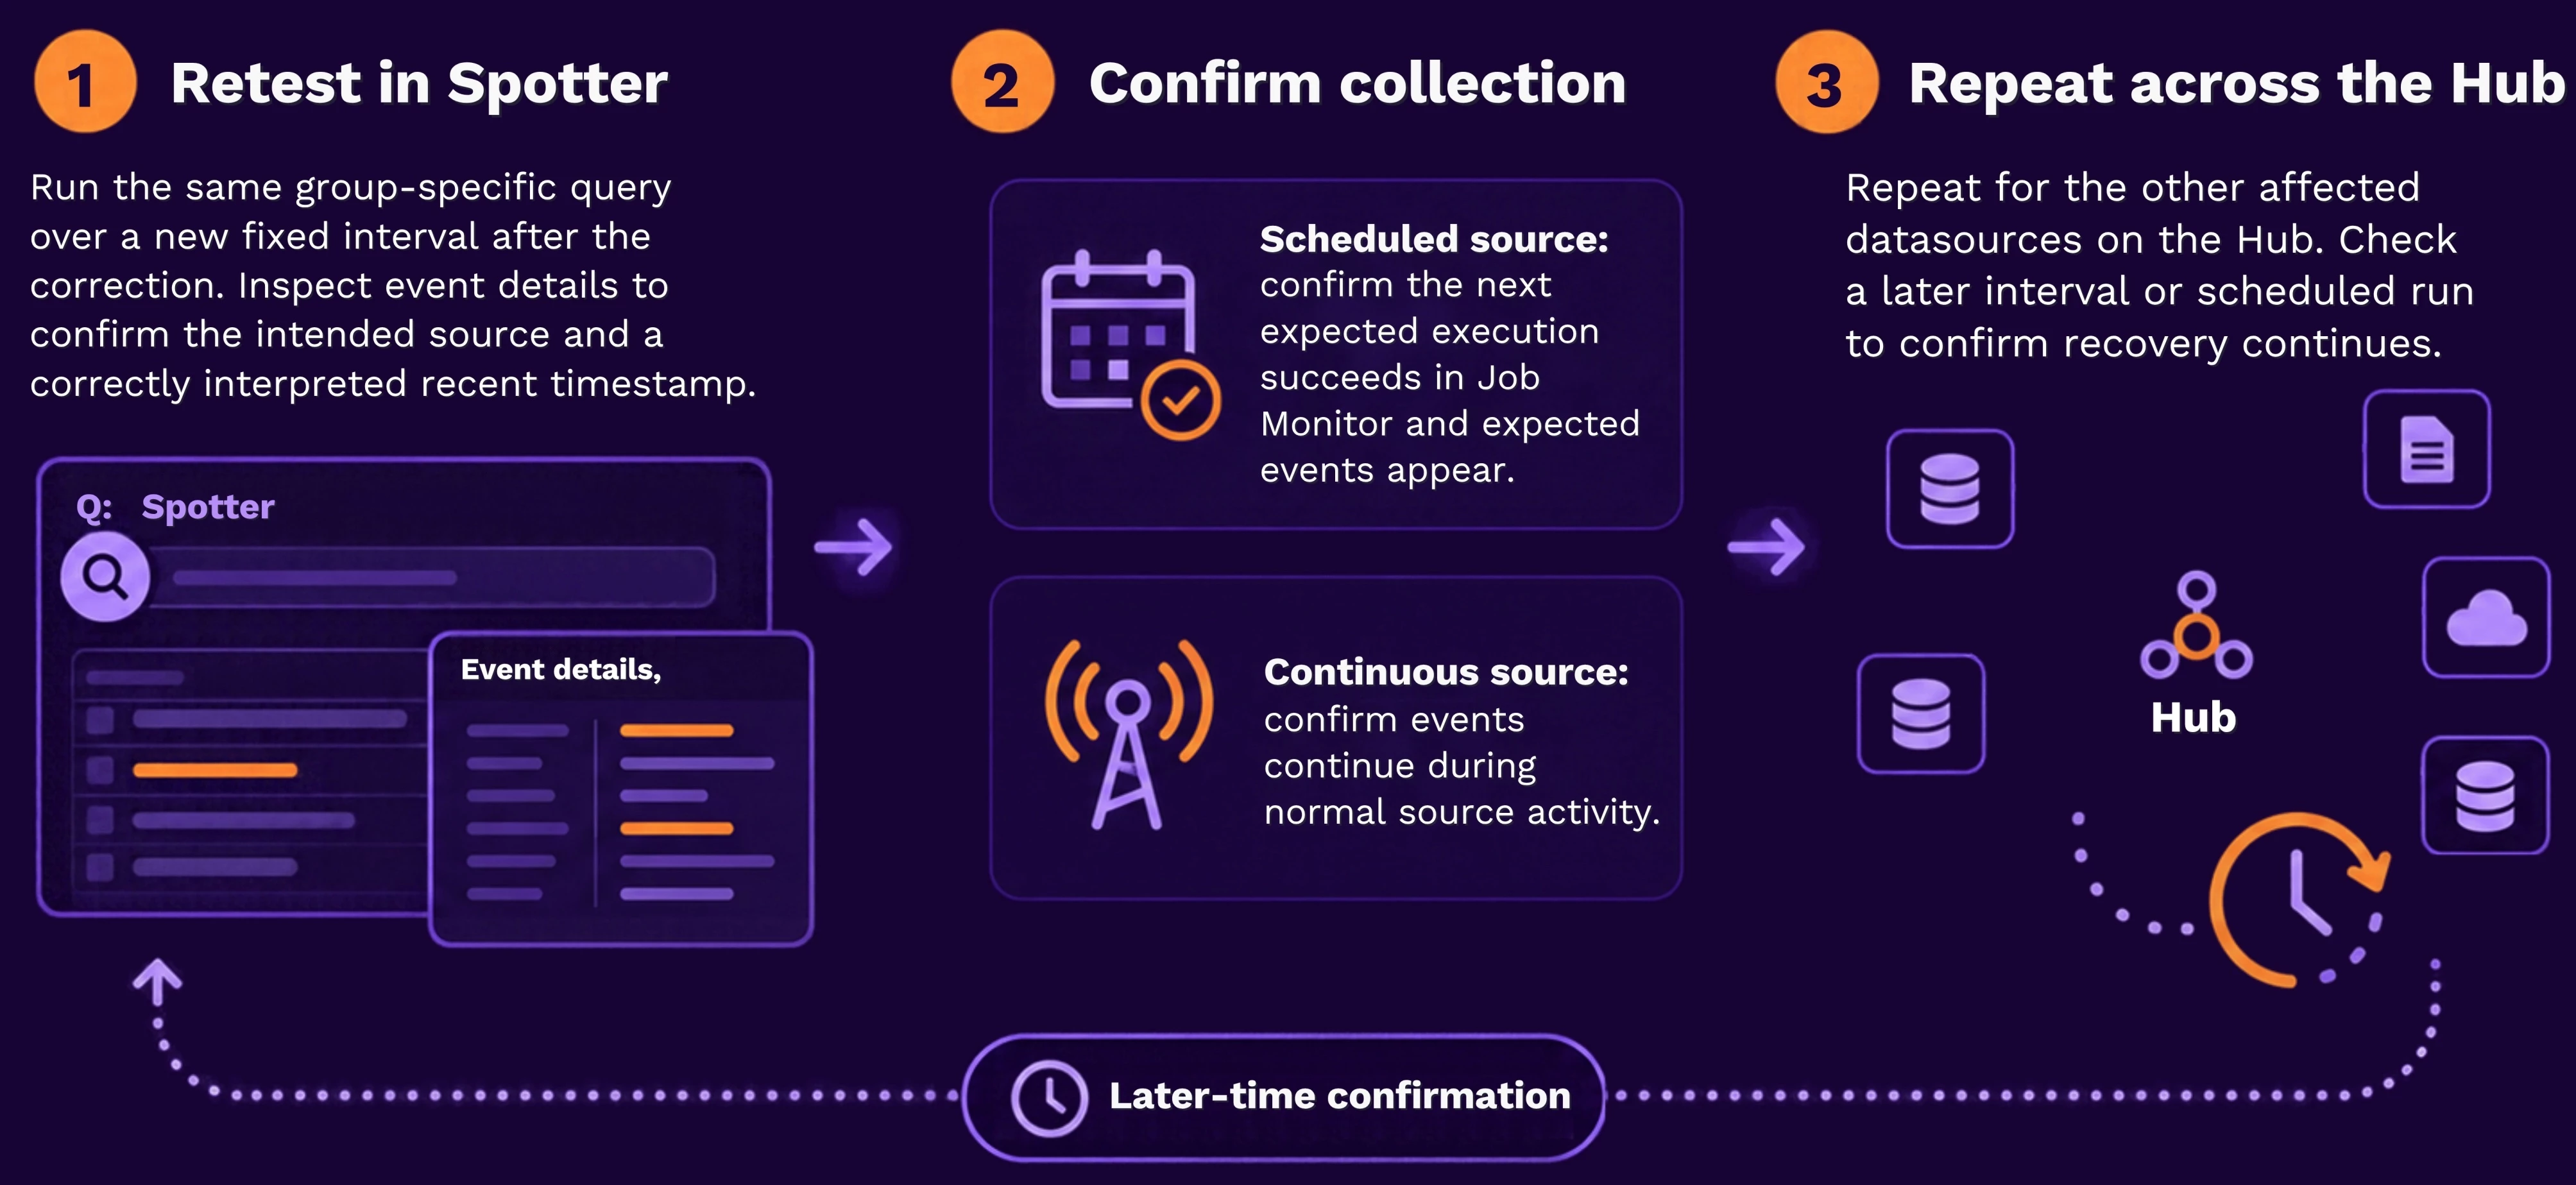
If the source may emit delayed historical events, compare with a newly generated or otherwise confirmed recent source event before concluding that current delivery has resumed. Obtain that sample through the source owner only when this validation requires it.
Success: Expected events from the affected sources are searchable again and continue to arrive. If Hub status still differs from actual collection, record that as a remaining reporting issue.
When to open a Support case
Open a case when several sources on one Hub remain affected, Hub communication/status remains unexplained, shared jobs fail or stall, or the available checks do not identify a correction. For managed Hubs, use the same initial application checks and ask Support to restore the affected functionality.
Include the observations already gathered in the steps above:
| Item | Where you obtained it |
|---|---|
| Tenant, Hub, affected datasource/group names, and collection methods | Step 1 — datasource assignment |
| Latest confirmed event timestamps, fixed search intervals, and time zone | Step 2 — Spotter comparison |
| Time you noticed the issue | Step 2 — your observation, not an inferred failure timestamp |
| Scheduled execution identifiers/outcomes and exact errors | Step 2 or Step 3 — Job Monitor |
| Hub status, update time if available, warnings, and screenshot | Step 3 — Hub/ingestion view |
| Working comparison source, known maintenance, and relevant changes | Steps 2–3 |
| Correction tested and post-correction results, if any | Step 4 |
State the requested help clearly, for example: “Two datasources assigned to Hub-East have no expected new searchable events; the comparison queries and Hub status are attached. Please investigate and restore collection.” Remove credentials and sensitive event content from attachments.
Need help restoring Hub collection?
If events are still missing after these checks, open a Securonix Support case. Include the Hub name, affected datasources, latest searchable event times, and any status warnings or job errors. Describe the checks you completed so Support can continue the investigation and help restore collection.
If the issue is resolved, confirm that later events continue to appear in Spotter for all affected datasources.
Related resources
- Troubleshooting Securonix Hub — deployment-specific diagnostics and recovery procedures
- Syslog Is Configured, but Logs Aren’t Appearing in Securonix
- Missing or Delayed Events in Securonix? Troubleshoot Collection and Ingestion